Starling Lab
The human circulation,
alive on your desk.
Starling Lab is a real-time simulator of the cardiovascular system. Turn the physiological knobs — heart rate, contractility, blood volume, vessel tone — and watch cardiac output, blood pressure, the ECG and the pressure waveforms respond exactly the way a real circulation would.
Nothing is scripted. Every number emerges from a closed-loop model integrated at two thousand steps a second.
Version 1.0 · One purchase covers Mac and iPad
Works entirely offline · No account · No data collected
Physiology is dynamic. Textbooks are not.
Cardiovascular physiology is one of the hardest topics students face, because it is dynamic and coupled: change one thing and five others move, often in directions nobody predicted. A static diagram cannot show that, and a single equation shows only one link of the chain.
The wet labs and hardware simulators that can show it are expensive, bookable only inside a university, and gone the moment the class ends. Starling Lab puts that same cause-and-effect learning on hardware students and teachers already own — online or off.
Nothing is scripted. Everything emerges.
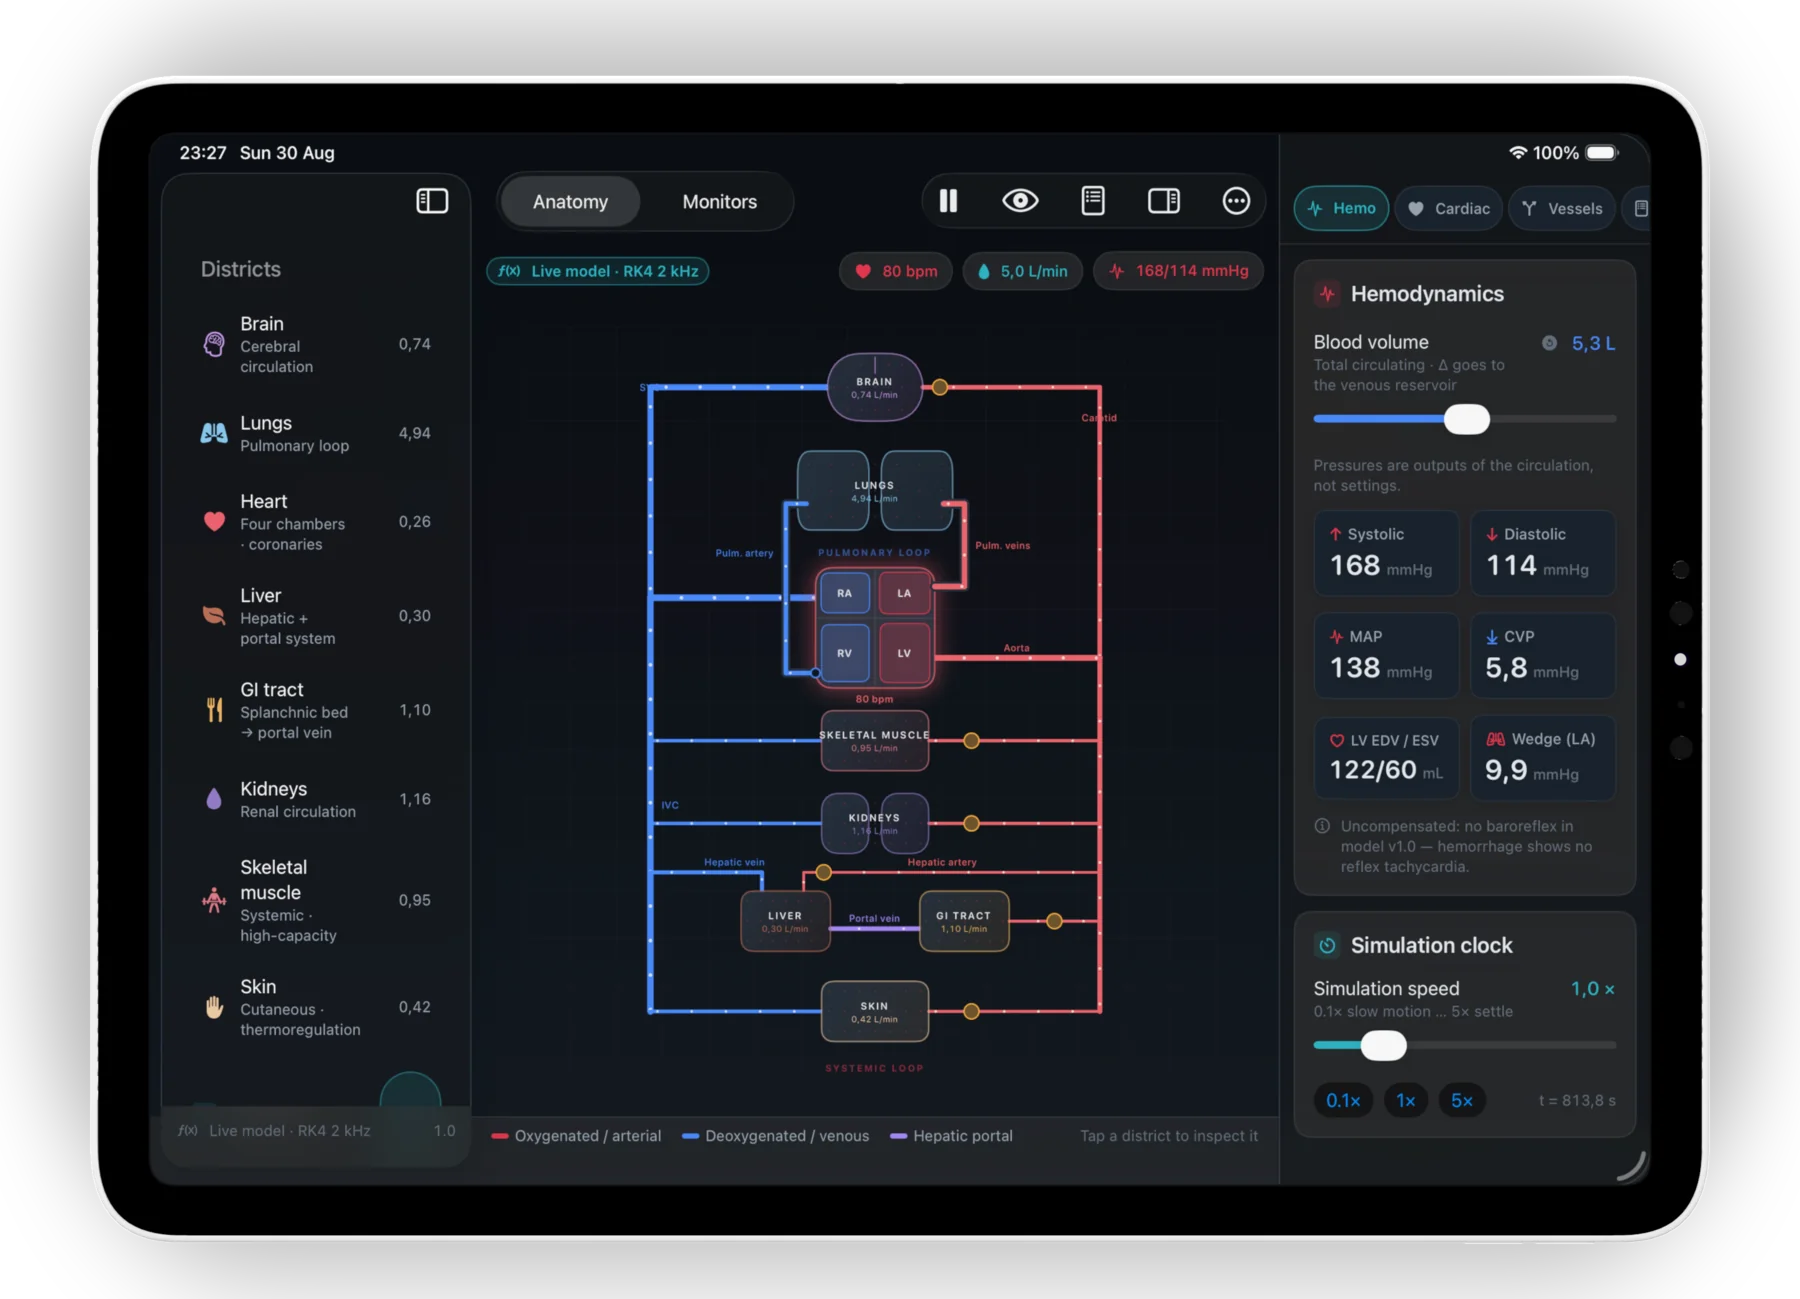
Starling Lab runs a closed-loop mathematical model of the whole circulation — four heart chambers, the pulmonary loop and seven systemic organ beds — solved with a fourth-order Runge–Kutta integrator at 2 kHz. You control the causes; the app shows the effects.
You set the causes
- Sinus rate — 30 to 200 bpm, with Brady 45, Rest 72 and Tachy 150 presets
- The five cardiac tropies, each from −100 % to +100 %
- Blood volume — the change goes to the venous reservoir first, as in haemorrhage or transfusion
- Vessel tone at six calibers, from the large arteries to the veins
- Arteriolar diameter, arteriolar resistance and precapillary sphincter, per district
The model returns the effects
- Cardiac output, stroke volume, ejection fraction and O₂ delivery
- Systolic, diastolic, MAP, pulse pressure, SVR and central venous pressure
- LV end-diastolic and end-systolic volume, and the wedge pressure
- A calibrated ECG with measured PR, QRS and QT
- Pressure waveforms at every level, from the left ventricle to the capillaries and back up the veins
The panel says it out loud: “Pressures are outputs of the circulation, not settings.” They emerge from conservation of volume, pressure–volume relations and Ohm's law for flow — the same handful of laws the real circulation runs on. The app is named for Ernest Starling, whose law of the heart falls out of the model on its own.
A monitor that reads like a monitor
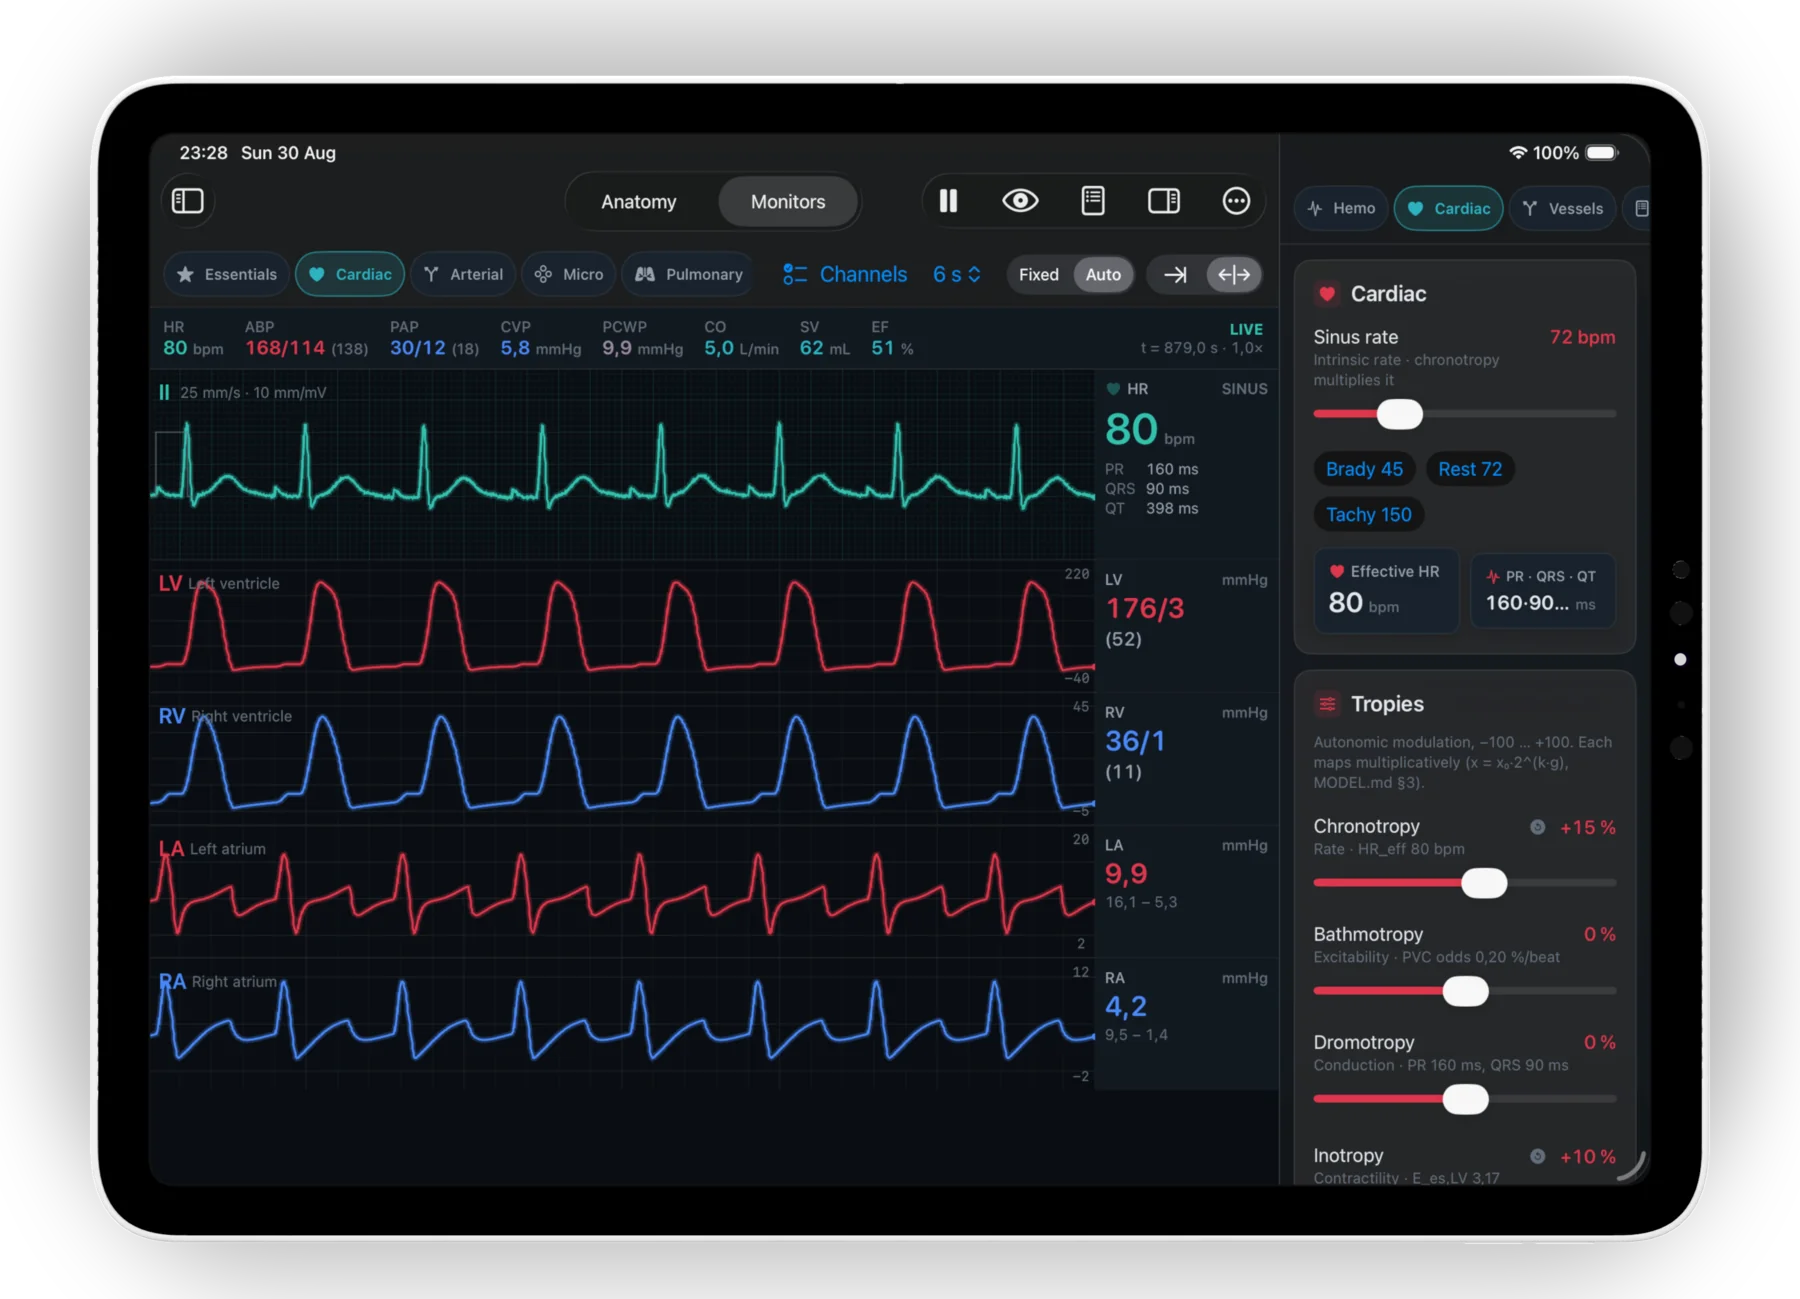
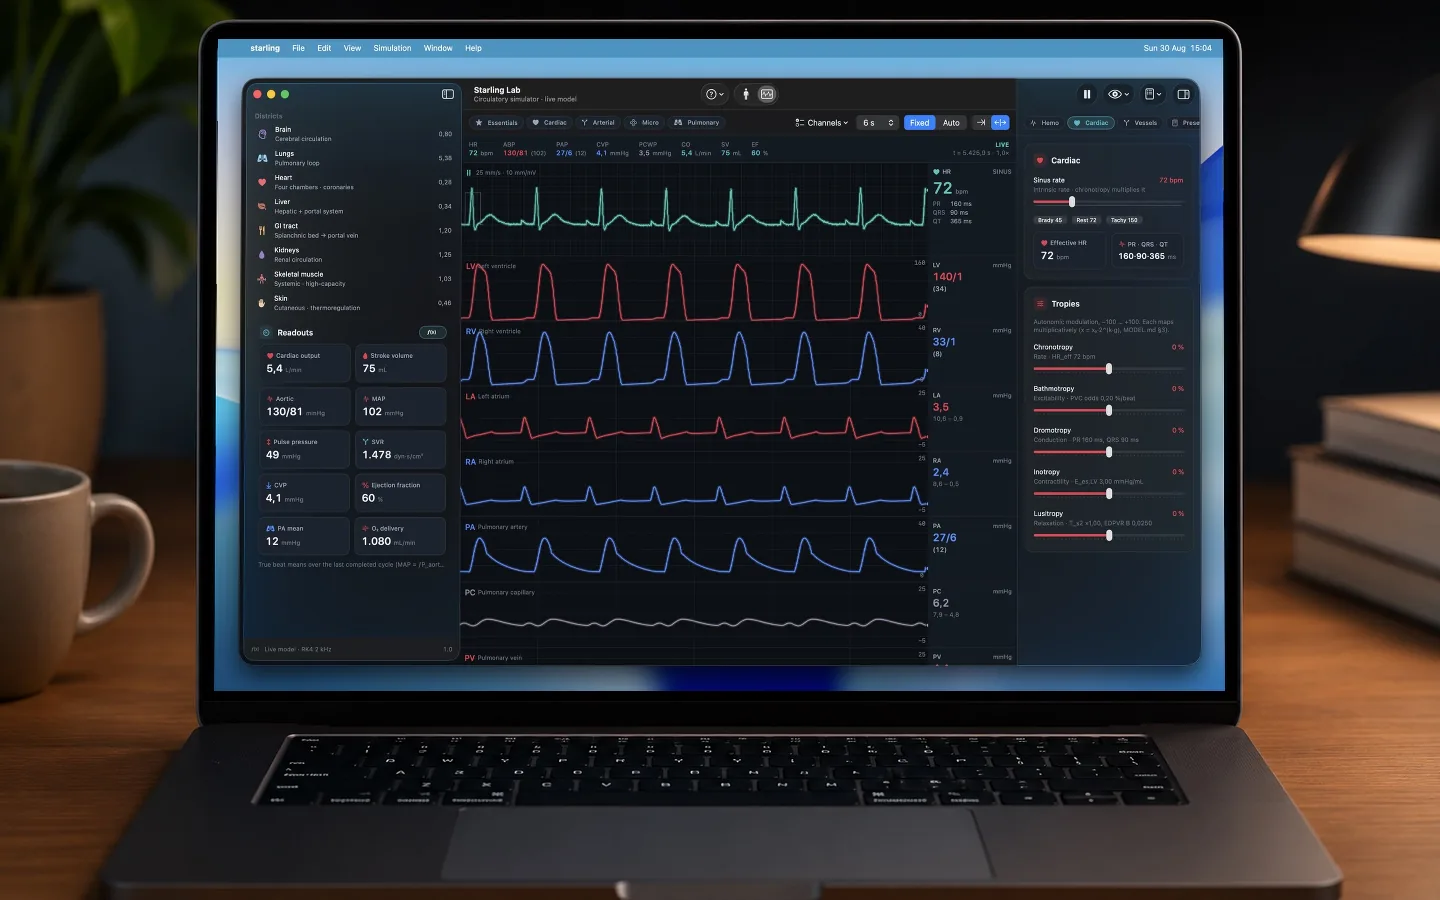
The ECG runs at the real calibration — 25 mm/s, 10 mm/mV — with PR, QRS and QT measured off the trace as you change the underlying cardiac properties. Below it, one pressure channel per level of the circulatory tree, each with its systolic, diastolic and mean.
Real ECG calibration
25 mm/s and 10 mm/mV, with the calibration pulse on the left of the strip and the rhythm named beside the rate.
Intervals measured, not stated
PR, QRS and QT come off the trace. Move dromotropy and watch the PR and QRS follow; move lusitropy and watch the QT.
The whole vitals strip
HR, ABP, PAP, CVP, PCWP, CO, SV and EF along the top, so the haemodynamic picture is one glance wide.
A window you choose
A six-second sweep by default, with fixed or auto scaling per channel — freeze the axis to compare two states honestly.
Channel presets
Every control is a cause
The heart is steered by its five cardiac properties — the tropies. Each runs from −100 % to +100 %: positive mimics sympathetic stimulation, negative mimics vagal tone, β-blockade or disease. Each slider names the parameter it is actually moving, so nothing is hidden behind a friendly label.
| Property | Controls | Underlying parameter | What you see change |
|---|---|---|---|
| Chronotropy | Rate | HR_eff | Multiplies the intrinsic sinus rate, and everything that follows from it. |
| Bathmotropy | Excitability | PVC odds/beat | Push it up and premature ventricular contractions start appearing on the strip on their own. |
| Dromotropy | Conduction | PR, QRS | The PR interval and the QRS width widen or narrow with it. |
| Inotropy | Contractility | E_es,LV | End-systolic elastance: stroke volume, ejection fraction and the height of the ventricular trace. |
| Lusitropy | Relaxation | τ, EDPVR | Relaxation time constant and end-diastolic stiffness: filling, and the QT on the ECG. |
Sinus rate has its own slider from 30 to 200 bpm, with one-tap Brady 45, Rest 72 and Tachy 150 presets — and chronotropy multiplies it, so intrinsic rate and autonomic drive stay two separate things, as they are in the body.
Start from a real clinical picture
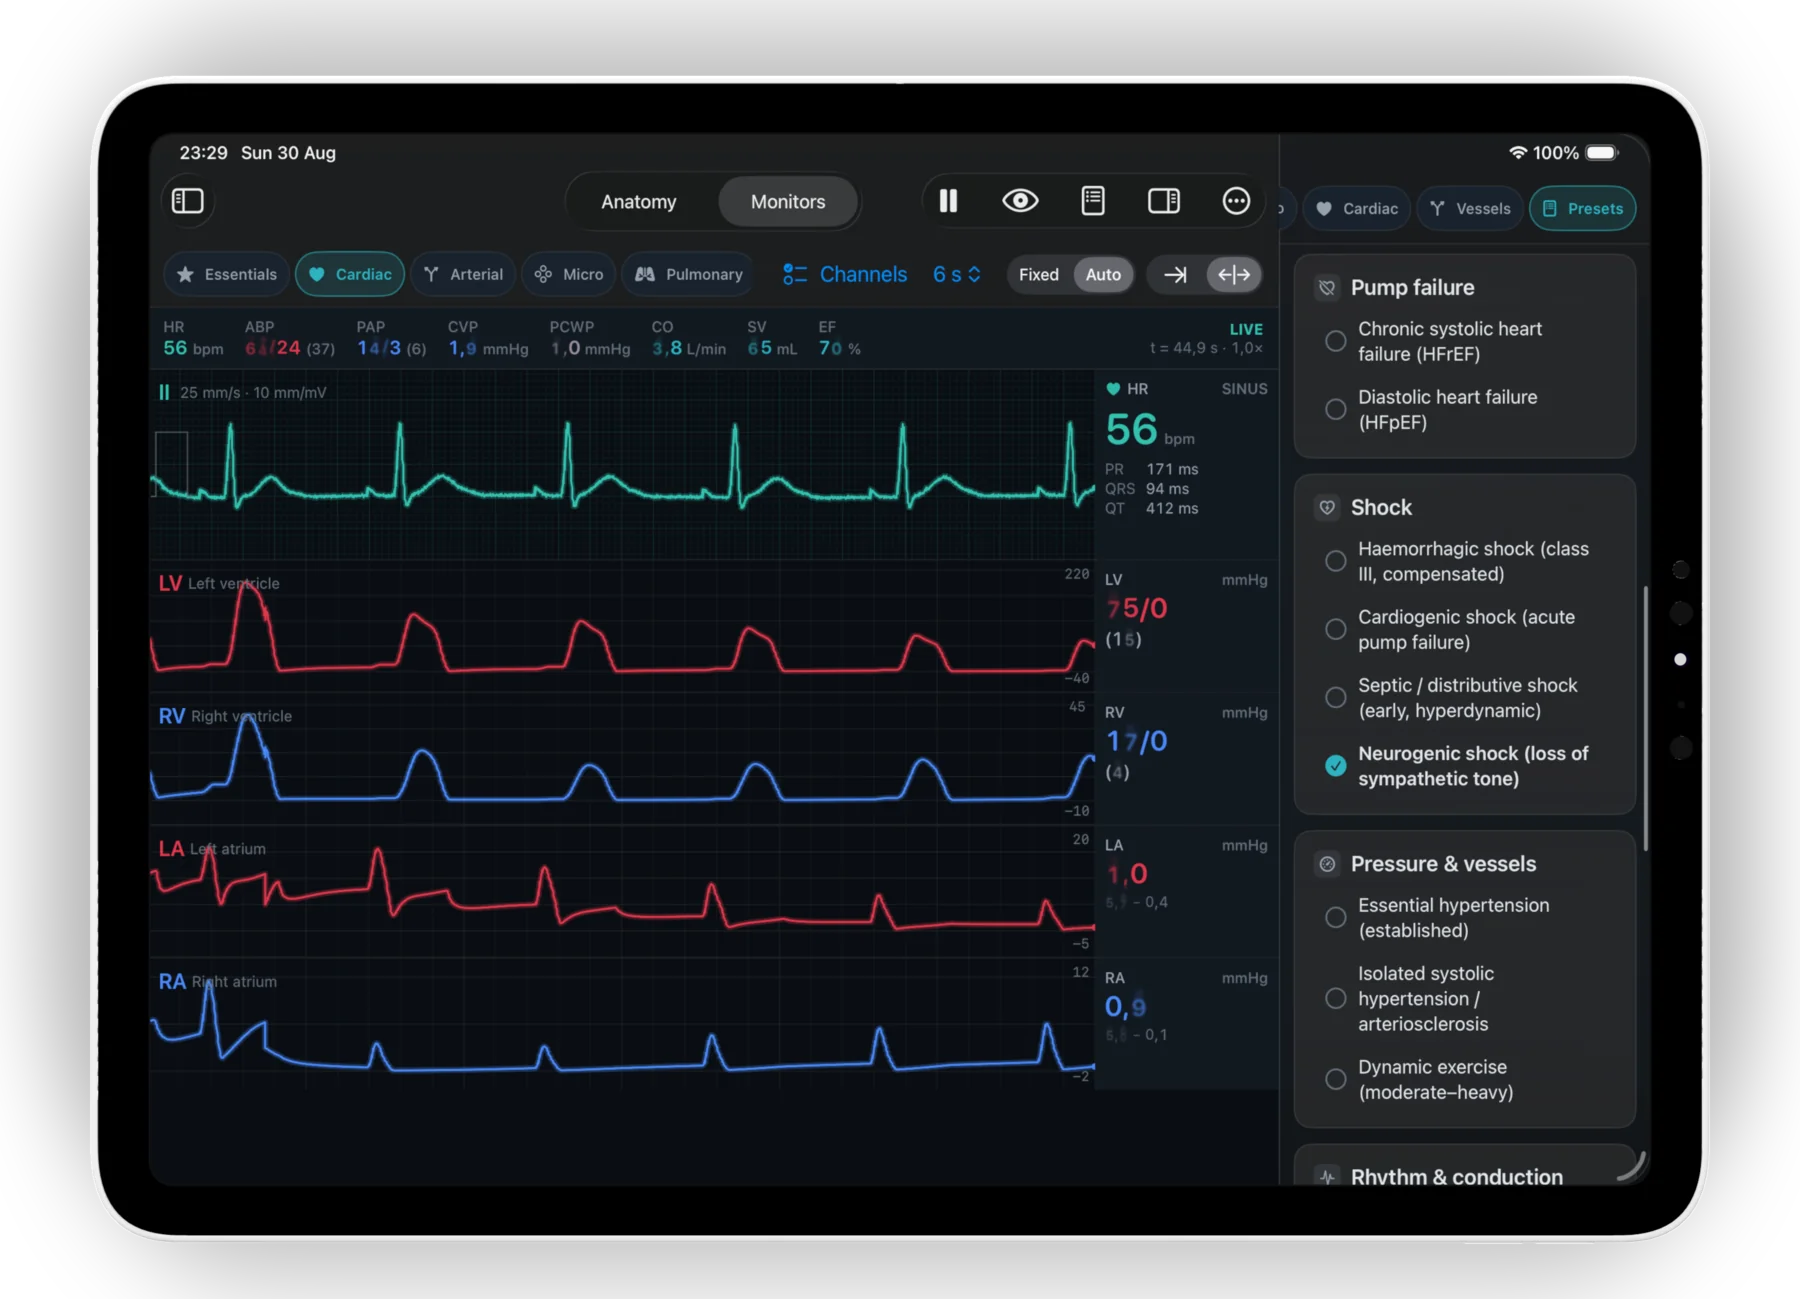
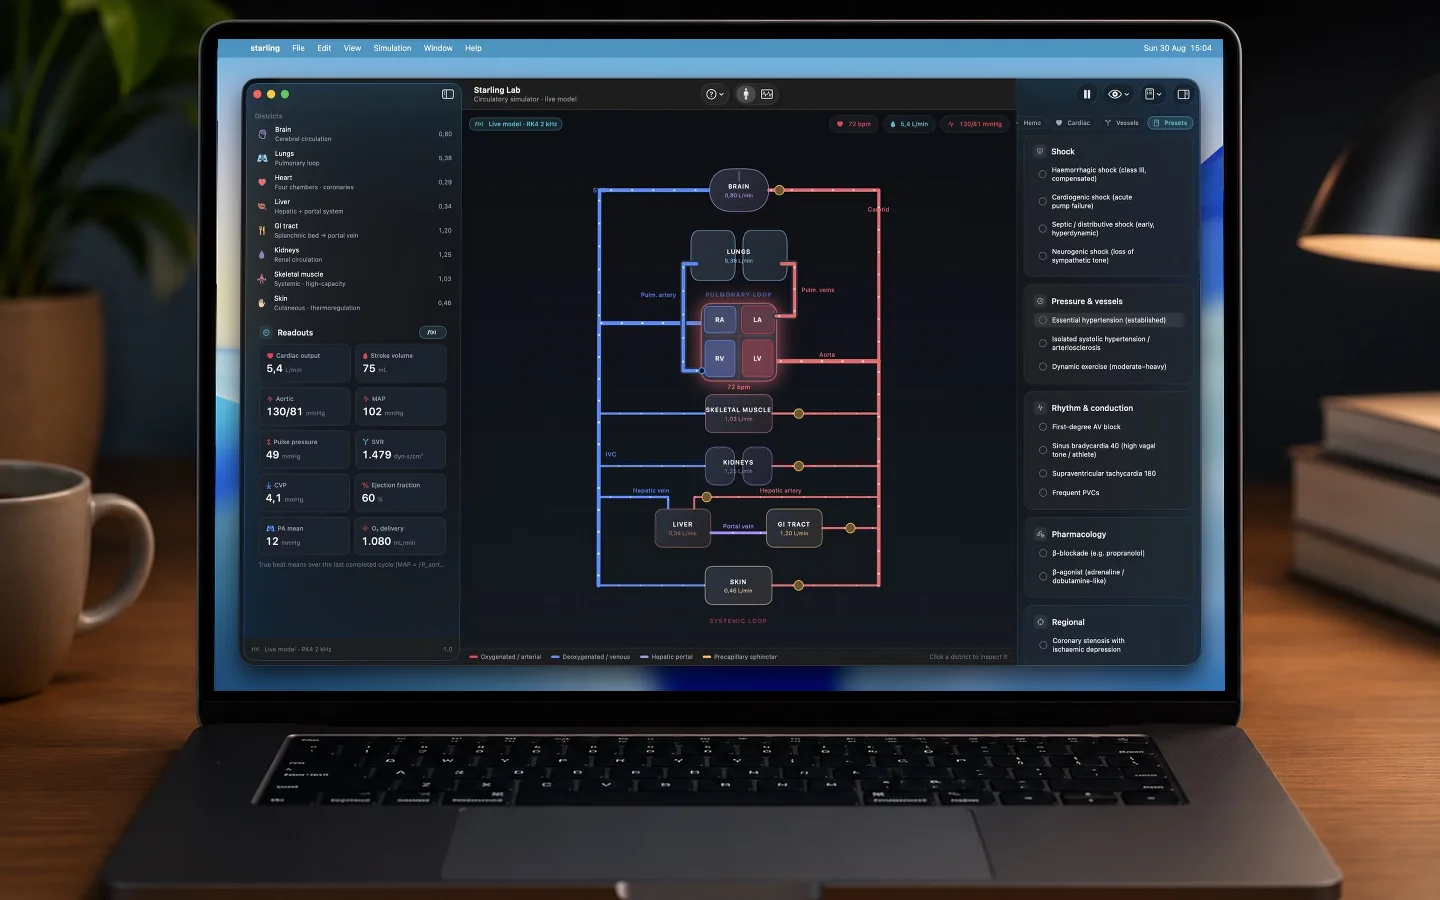
You do not have to build a disease slider by slider. The teaching presets load a whole physiological state at once — then leave every control free, so the class can take it apart and ask why each number landed where it did.
Load it, then break it apart
Select Neurogenic shock (loss of sympathetic tone) and the monitor answers immediately: heart rate 56, arterial pressure 61/24, cardiac output 3.8 L/min, left ventricle 75/0. Nothing was typed in — the preset set the causes, and the model produced that picture.
From there the interesting question is the one a diagram cannot answer: why is this hypotension different from the haemorrhagic one? Load them both and compare the filling pressures.
Volume
- Haemorrhage 30 %
- Volume overload
- Venous pooling on standing
Pump failure & shock
- Systolic failure (HFrEF)
- Diastolic failure (HFpEF)
- Haemorrhagic shock, class III
- Cardiogenic shock
- Septic / distributive shock
- Neurogenic shock
Pressure & vessels
- Essential hypertension
- Isolated systolic hypertension
- Dynamic exercise
Rhythm, drugs & regional
- First-degree AV block
- Sinus bradycardia 40 (athlete)
- Supraventricular tachycardia 180
- Frequent PVCs
- β-blockade
- β-agonist
- Coronary stenosis
All the way down to one capillary
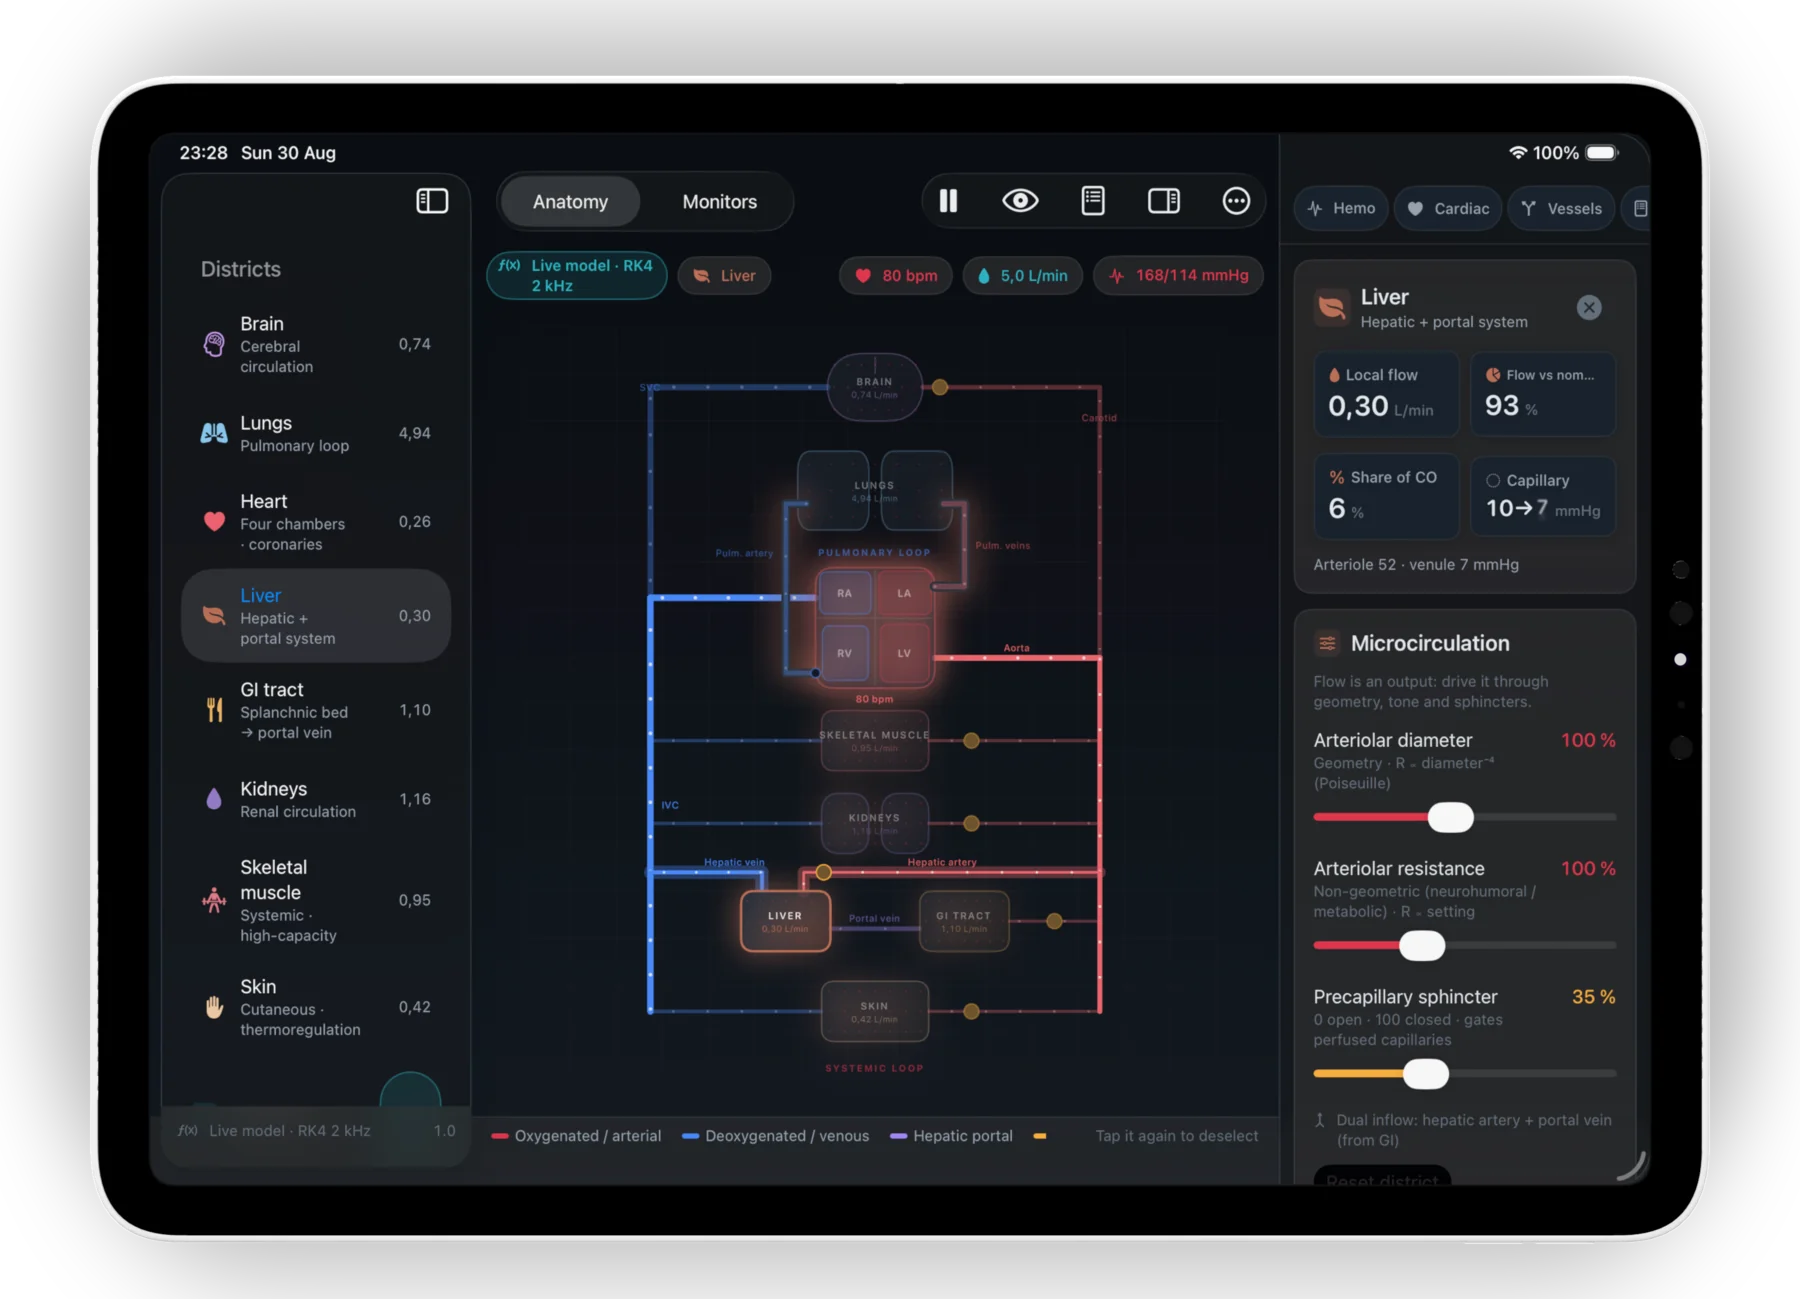
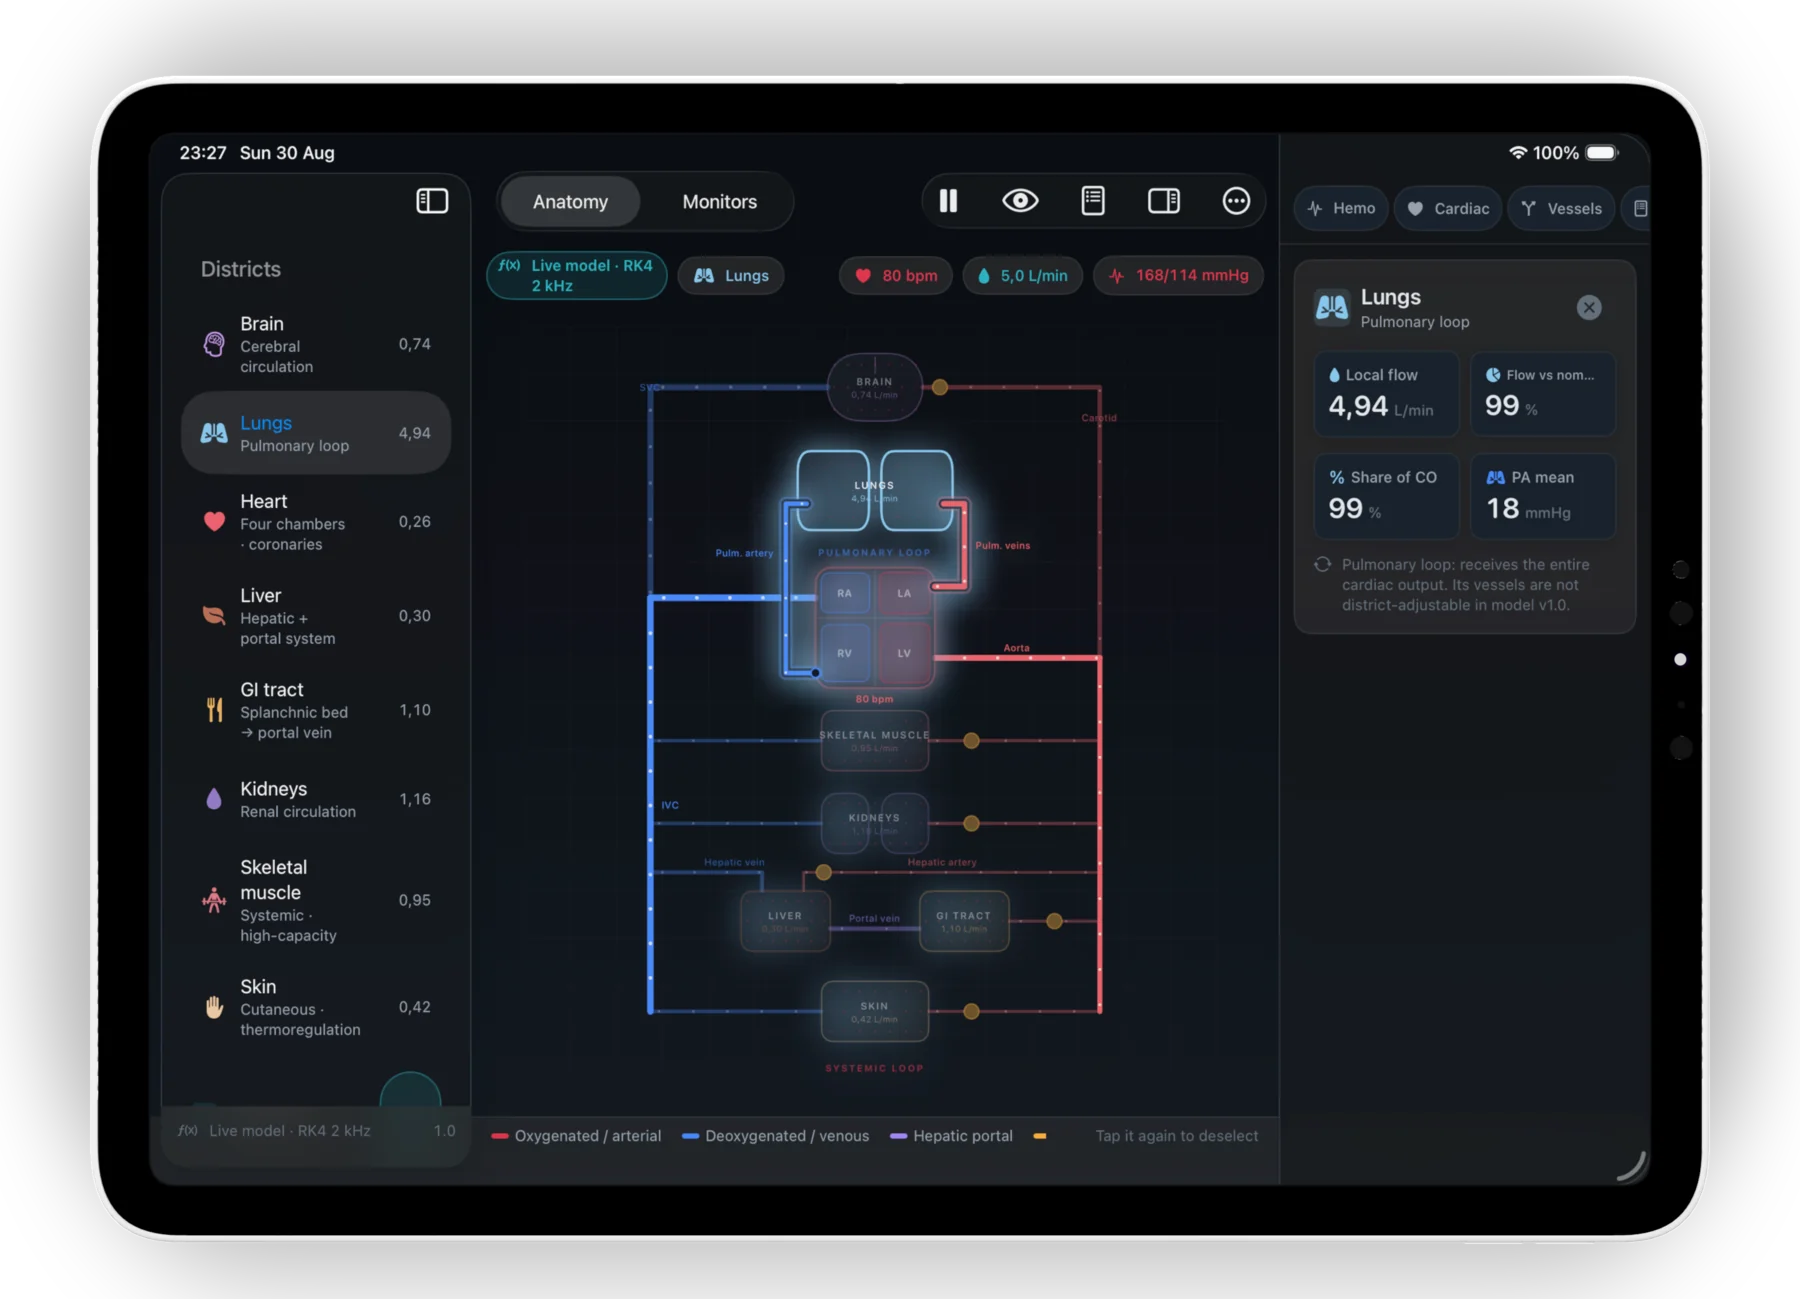
Tap any district and the inspector opens on its local flow, its share of cardiac output, and the pressure drop across its capillary bed. Then you get its microcirculation to yourself.
Arteriolar diameter — the geometry
Resistance goes as the fourth power of the diameter. Poiseuille is not a formula you are asked to trust here; it is the slider you are holding.
Arteriolar resistance — everything else
The non-geometric part: neurohumoral and metabolic tone, set independently of caliber, so you can separate the two causes that a single "resistance" number normally hides.
Precapillary sphincter — the gate
From fully open to fully closed, gating how much of the capillary bed is actually perfused. Watch the capillary pressure drop change as the gate shuts.
The liver even carries its real plumbing: dual inflow from the hepatic artery and the portal vein, so what you do to the gut arrives downstream in the liver — visibly, in the flow numbers.
Vasculature, caliber by caliber
Six independent sliders across the whole tree. The same word "vasoconstriction" produces opposite effects depending on which vessel you constrict — take arterioles up and capillary pressure falls; take venules up and it rises. That second one is oedema, and here you can watch it happen.
Eight districts, each with its own character
Brain
Cerebral circulation
0,74 L/min at rest
Lungs
Pulmonary loop
4,94 L/min at rest
Heart
Four chambers · coronaries
0,26 L/min at rest
Liver
Hepatic + portal system
0,30 L/min at rest
GI tract
Splanchnic bed → portal vein
1,10 L/min at rest
Kidneys
Renal circulation
1,16 L/min at rest
Skeletal muscle
Systemic · high-capacity
0,95 L/min at rest
Skin
Cutaneous · thermoregulation
0,42 L/min at rest
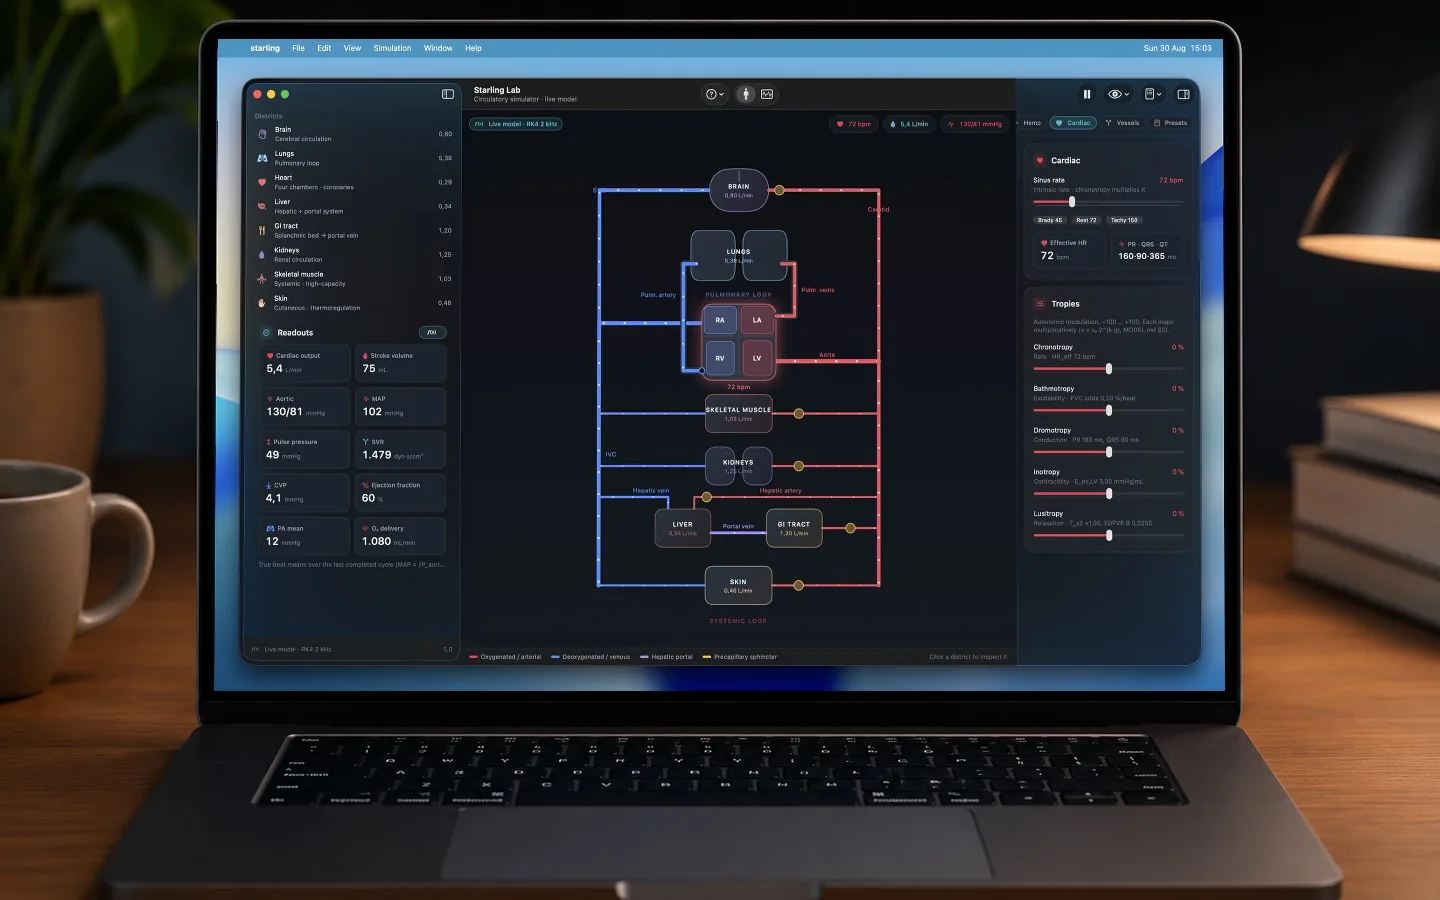
The same lab, on the Mac
A proper Mac app with a real menu bar and a three-column layout: districts and readouts on the left, the circulation in the middle, the controls on the right. Nothing is hidden behind a tab you have to remember.
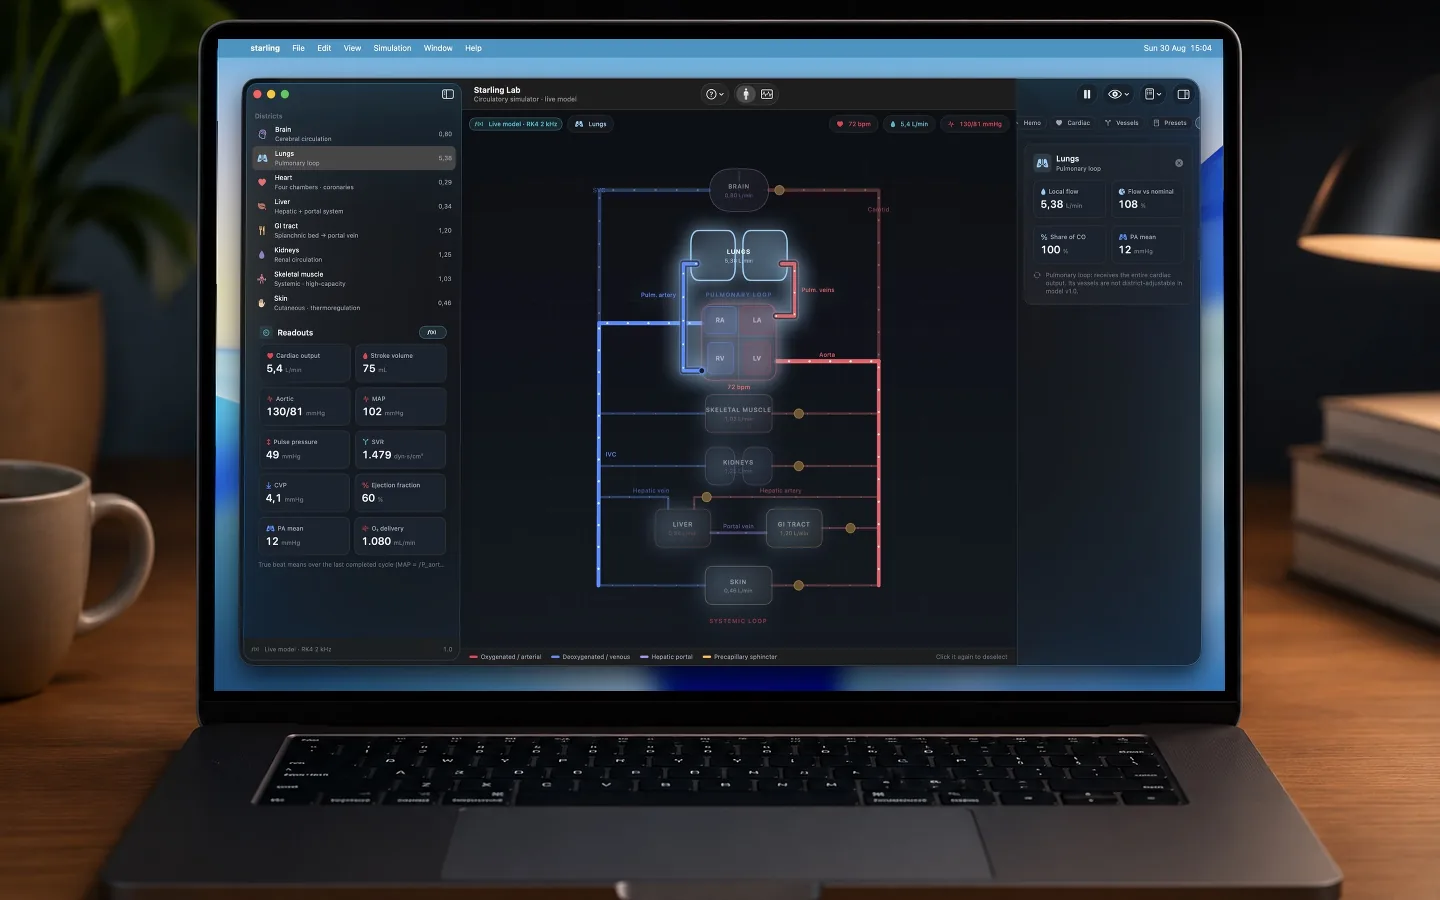
Ten readouts, always in view
The left column keeps the whole-body picture on screen while you work — true beat means taken over the last completed cycle, not a running average that lags behind what you just did.
Who it is for
Medical and nursing students
Cardiovascular physiology, pathophysiology and pharmacology, with the coupling made visible rather than described.
Physiology undergraduates
Biology and pre-health students who need intuition for the system, not just the formulas that describe pieces of it.
Educators and instructors
A live demonstration tool for lectures, labs and flipped-classroom exercises — load a scenario and let the class predict the rest.
Curious self-learners
Anyone who wants to genuinely understand how the heart and the circulation work, without booking a laboratory.
Big, legible traces and a landscape full-screen layout on iPad make it a natural lecture tool: project it, change one variable live, and let the class predict the rest before you let go of the slider.
Buy once, learn everywhere
Starling Lab is a native SwiftUI app for macOS and iPadOS, sold as a single universal purchase — buy it once and it is yours on both. On iPad it runs landscape and full screen, built around wide side-by-side traces.
No internet connection is required for any feature. Nothing to set up, no account to create: open it and the circulation is already running.
Good to know
A model is honest about its own edges, and version 1.0 says where they are — in the app, right next to the numbers they affect.
Version 1.0 is uncompensated: there is no baroreflex
A haemorrhage shows no reflex tachycardia, because the reflex is not in the model yet. That is deliberate for teaching — you see the raw mechanical consequence first, before the body’s answer to it — and the app says so on the panel rather than letting you assume otherwise.
The pulmonary vessels are not district-adjustable
The pulmonary loop receives the entire cardiac output and is modelled as a whole in version 1.0, so it has readouts but no per-caliber controls of its own.
Your data never leaves your device
Because we never collect any. The App Store privacy label reads Data Not Collected.
No account, no login, no server
There is nothing to sign up for and nothing to sign in to. The app has no backend at all.
No data collection of any kind
The App Store privacy label reads "Data Not Collected", and it is accurate. The only thing stored is your own local preferences, on your device.
No network use at all
Every feature works offline. The app makes no requests, so nothing about you can be sent anywhere.
No ads, no trackers, no third-party SDKs
No analytics, no advertising frameworks, and no telemetry. We do not know who uses the app, when, or how.
Understand the circulation — don't just memorize it.
Starling Lab is an educational model, not a medical device. It simulates an average resting adult and is intended for learning and teaching only. Every physiological value it produces is a plausible textbook magnitude generated by the model, not a clinical measurement, and nothing in the app should be relied upon for any clinical decision.