BTC Miner Plan+ · iPhone & iPad · iOS 18.5 or later
Would mining on sunlight
actually pay?
A what-if dashboard for a Bitcoin mining rig powered by solar panels and a battery. Pick an ASIC, say how many you would run, put them somewhere on the map, size the panels and the storage, and the app works out what they would mine, what the sun would cover, what the grid would have to supply, and when, if ever, the investment comes back.
It uses live blockchain numbers and a full year of real hourly irradiance for your coordinates, then shows every intermediate figure. Nothing is mined, no wallet is involved: it is a simulator for understanding the economics, built for learning.
Version 1.0 · Listed on the App Store as "BTC Miner Plan" · One-time purchase
No account · No analytics · No tracking · Nothing collected
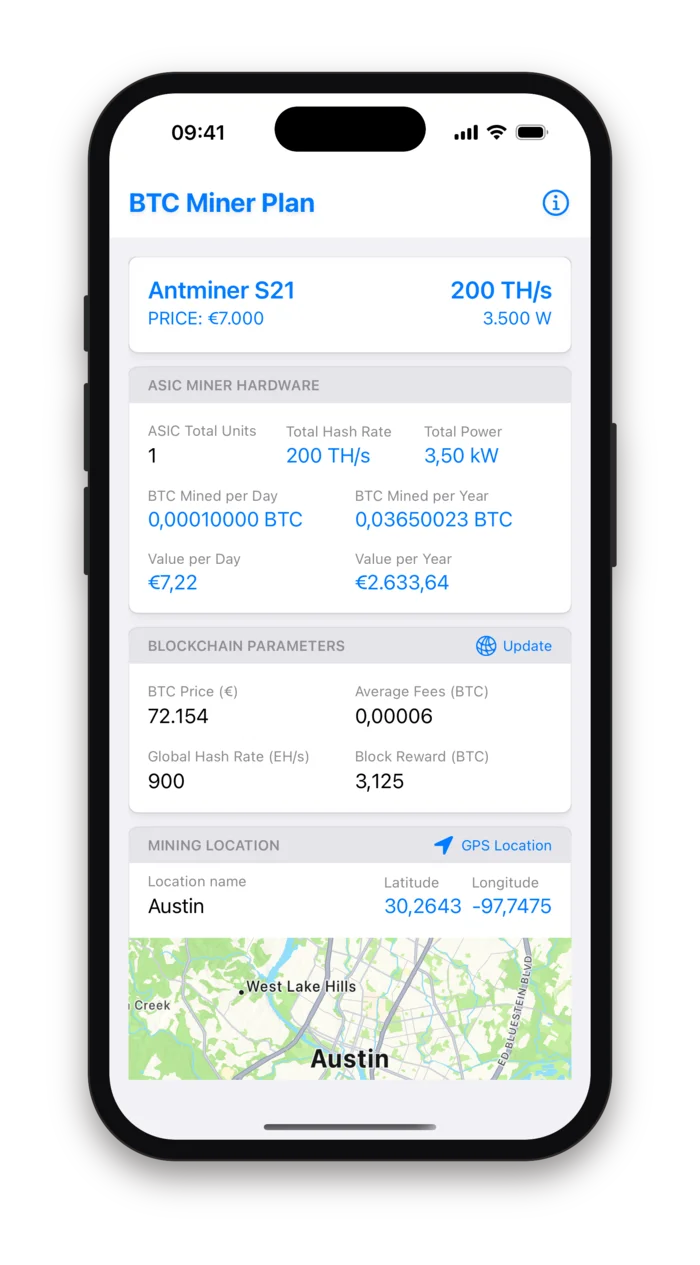
One screen, the whole chain of consequences
Mining profitability calculators on the web take a hash rate and an electricity price and give you a number. That hides the interesting part. A miner runs flat out, day and night, every day of the year; a solar plant produces nothing at night, little in winter and more than you can use at noon in July. Whether the two fit together depends on where the panels are, how big the battery is and what the grid pays for the surplus.
BTC Miner Plan lays that chain out on a single scrolling dashboard: hardware, blockchain, location, panels, battery, consumption, money. Change one field and everything below it recalculates. The charts show the year month by month, so a plant that looks fine on an annual average shows its winter deficit at once.
The rig
An ASIC from the built-in list or one you add, times the number of units. Hash rate, power and purchase cost follow from that.
The plant
Panels by peak watt and count, an efficiency, a battery capacity and its losses, and a place on the map that decides how much sun there is.
The economics
Live BTC price, block reward and fees, your grid tariffs, your installation costs per kilowatt-peak and per kilowatt hour. Out comes break-even and ROI.
Describe the rig and the plant
The dashboard is a column of cards, each with a few editable fields and the figures derived from them. Every value you type is kept on the device, so the plan is still there the next time you open the app.
- ASIC Miner Hardware
- The selected model and how many of them. The card shows the total hash rate and power, the BTC mined per day and per year at the current network figures, and what that is worth in euros at the current price.
- Blockchain parameters
- BTC price in euros, average fees per block, global hash rate in exahash per second and block reward. Update pulls the price, the reward and the current fee level from public APIs; the global hash rate is yours to set and starts at 900 EH/s.
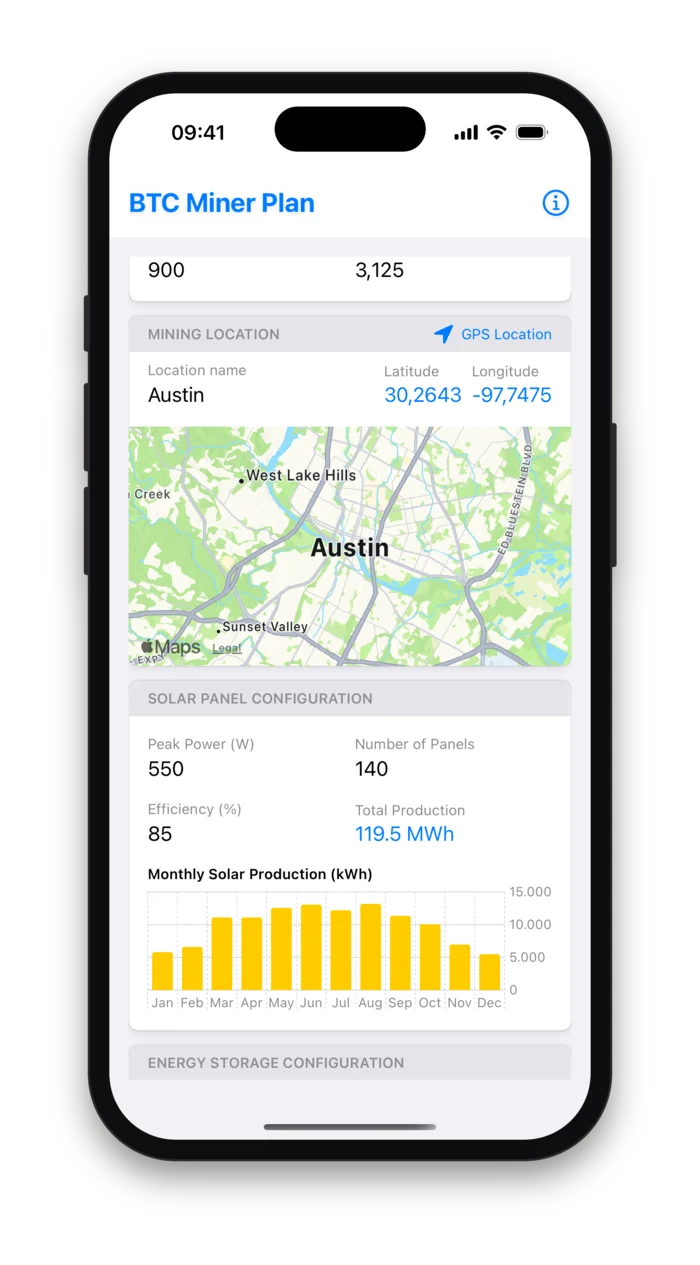
- Mining location
- Type a place name and the app geocodes it, or press GPS Location to use where you are. The coordinates drive the solar data, and a map confirms you got the right Austin.
- Solar panel configuration
- Peak power per panel, number of panels and an overall efficiency that stands in for inverter losses, soiling and orientation. The card shows the yearly production and a bar chart by month.
- Energy storage
- Battery capacity in kilowatt hours and a loss percentage. The chart shows how much the battery actually discharges each month, which is the useful number: a battery that never empties is too big.
- Financial
- Cost of the solar installation per kilowatt-peak, of the storage per kilowatt hour, and the price you pay the grid and the price it pays you. Defaults of 600, 300 and ten cents each way.
Hour by hour, for a whole year
The energy side is not an average. For the coordinates you set, the app downloads the hourly shortwave radiation of the previous calendar year from the ERA5 reanalysis, 8,760 values, and turns each one into kilowatt hours from your installed peak power and efficiency. The miners' consumption is flat, so the difference between the two curves is known for every hour.
- Production
- The ERA5 archive from Open-Meteo gives hourly radiation for the previous year at your latitude and longitude. Leap days are dropped so the year is always 365 days.
- Consumption
- Rig power times 24 hours, every day. Miners do not have weekends.
- Battery and grid
- Each hour, a surplus charges the battery up to its usable capacity and the rest is exported; a deficit drains the battery and the rest is imported. Monthly charts show consumption, grid input and grid output.
- Money per month
- Mining revenue at the BTC price, export revenue at the sell price, import cost at the buy price. The twelve months are repeated to cover five, ten and fifteen years.
The two formulas
productionh = GHIh · panels · peak power · efficiency / 1000BTC per day = (your TH/s ÷ network EH/s) · 144 blocks · (reward + fees)GHI is global horizontal irradiance in watts per square metre, so a panel rated at 550 watts gives 550 watt hours in an hour at 1,000 W/m², times the efficiency you set. Blocks come every ten minutes on average, 144 a day.
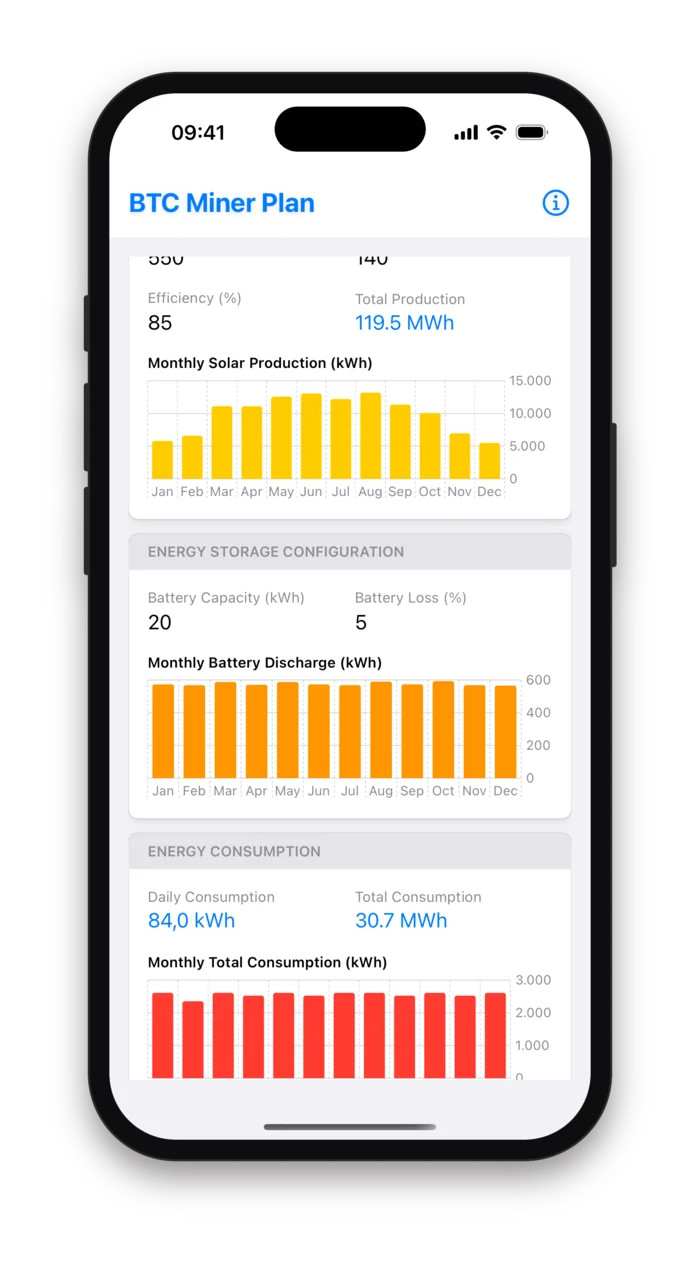
Then the money
The Financial card adds up the investment, runs the first year's cash flow twelve months at a time, and tells you when the cumulative profit crosses the investment. A slider underneath repeats the whole summary at a different Bitcoin price, from half of today's to four and a half times it, so you can see how much of the answer is the coin and how much is the plant.
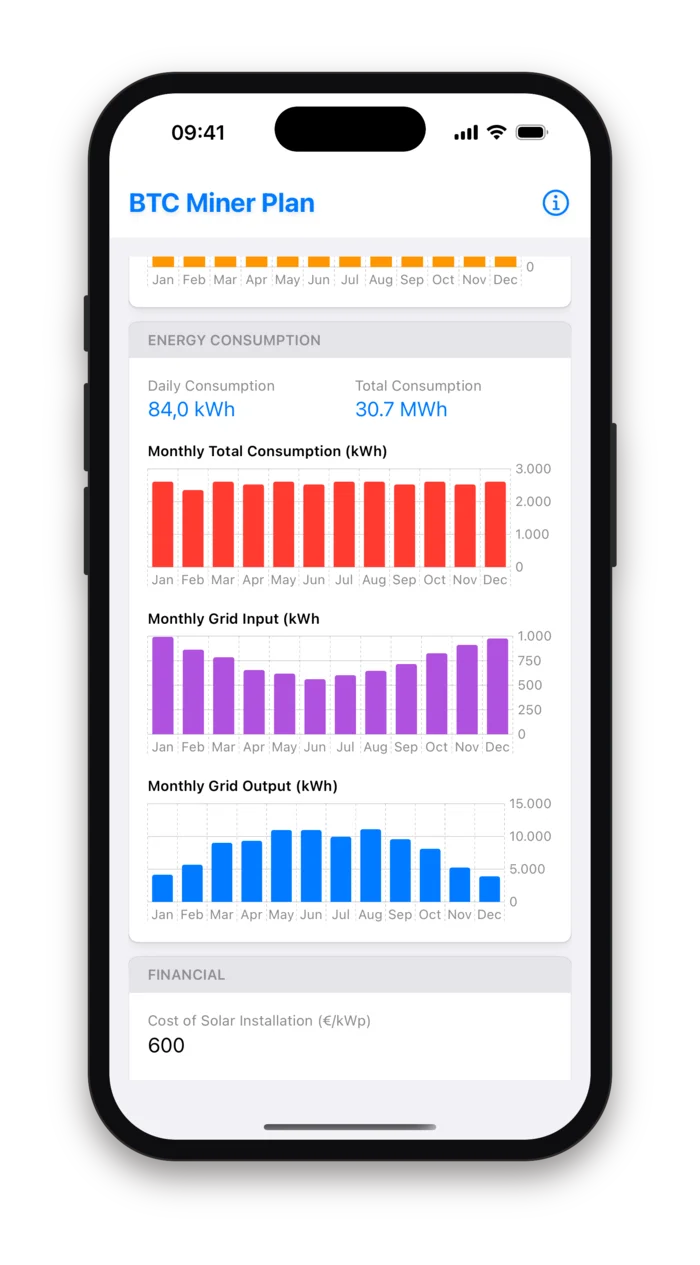
Where the energy goes
Consumption, grid input and grid output month by month. The purple and blue charts are the mirror image of each other: what the sun does not cover in December is bought, what it over-delivers in June is sold.
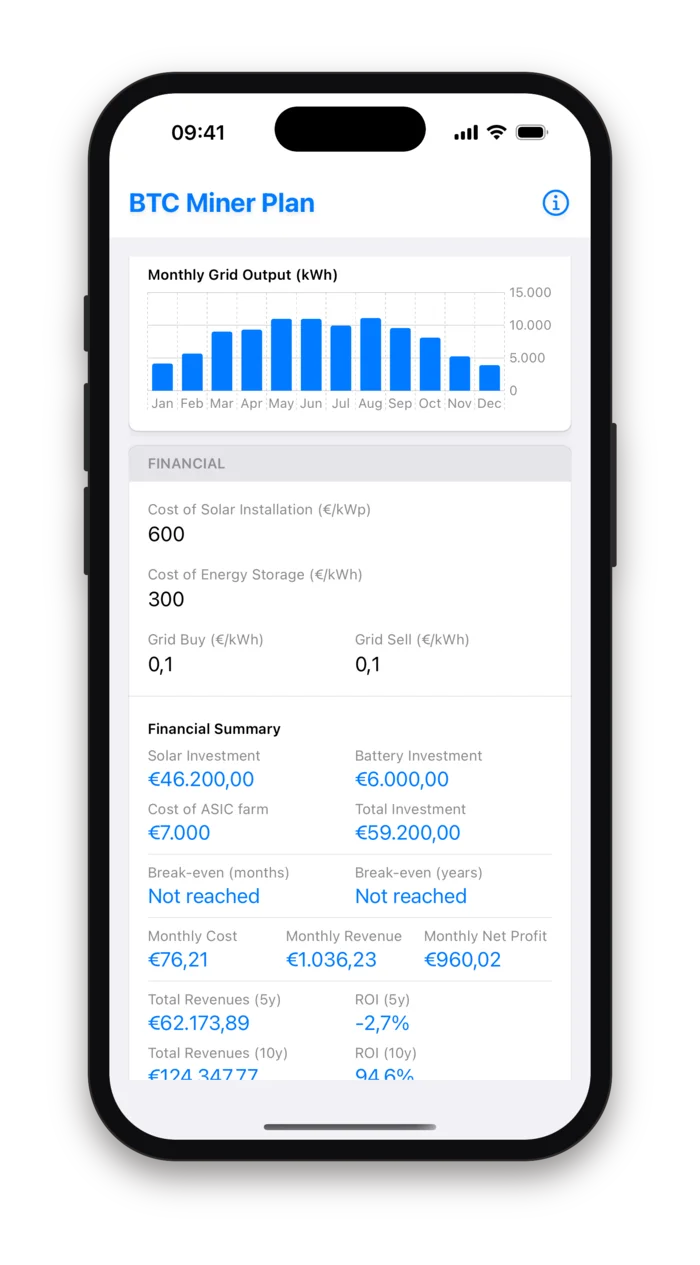
Investment and break-even
The three investments and their total, then the month in which cumulative net profit first exceeds it. If that does not happen within sixty months it says so.
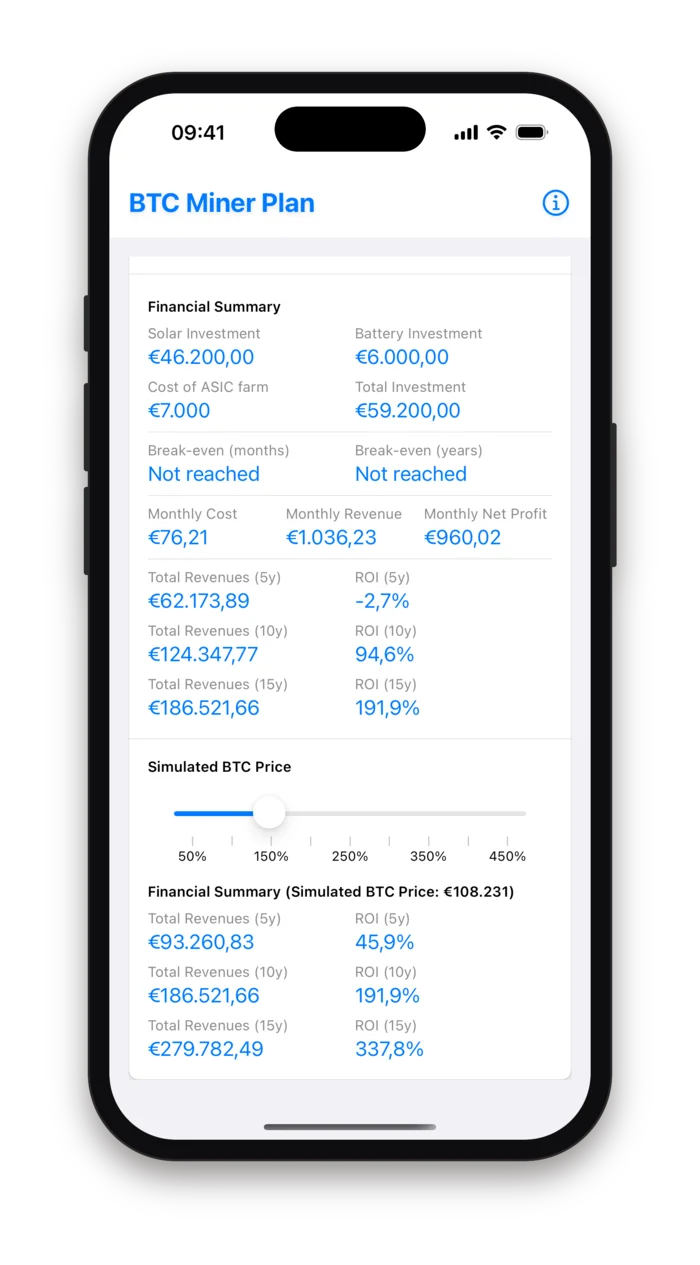
What if the price doubles
Revenues and ROI at five, ten and fifteen years, and the same table again at the price on the slider. Sliding it is the quickest way to see how much of the plan is a bet on Bitcoin.
The screenshots show the app's defaults: a single Antminer S21 next to a 77 kilowatt-peak plant in Austin. That plant costs far more than the miner it feeds and sells most of its output back to the grid at ten cents, which is why the break-even reads "Not reached" within the five-year horizon. Ten miners on the same roof is a different story, and the point of the app is that you can type 10 and see it.
Eleven miners, or your own
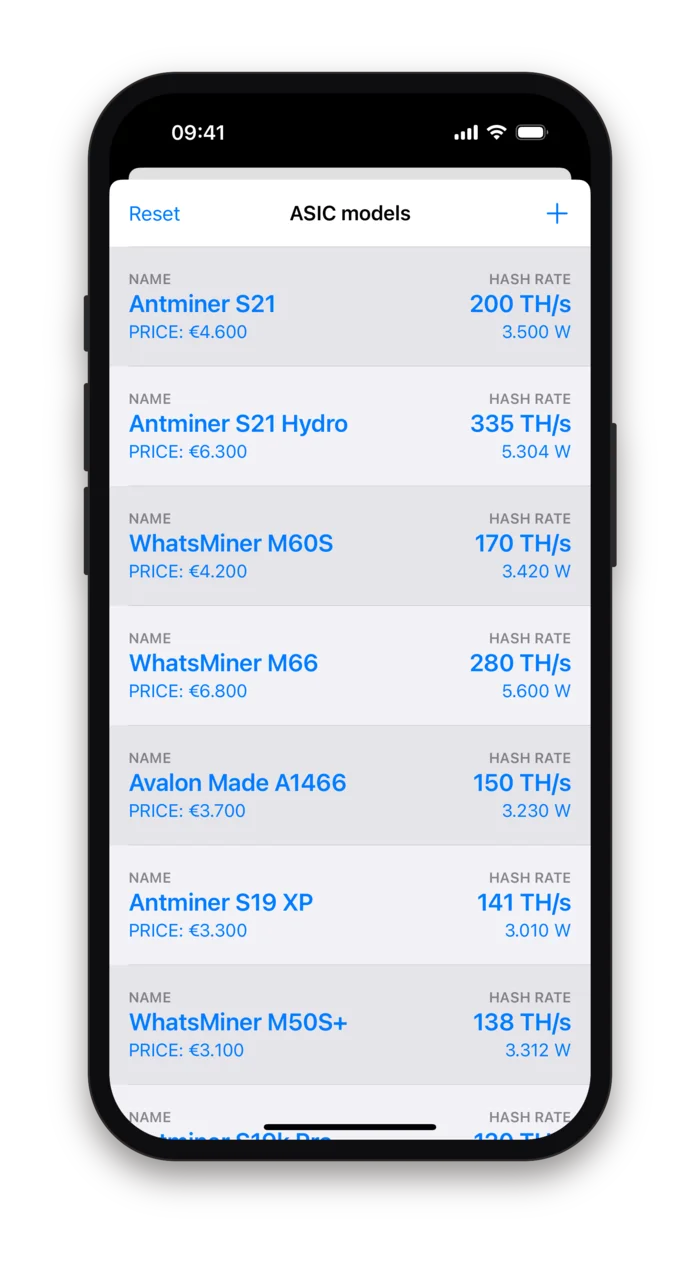
Tap the hardware card to choose from a list of current ASICs with their hash rate, power draw and a street price in euros: Antminer S21, S21 Hydro, S21 XP Hydro, S19 XP and S19k Pro, WhatsMiner M60S, M66, M66S Hydro, M63S Hydro and M50S+, and the Avalon Made A1466. Prices are typical figures at the time of release and are meant to be edited.
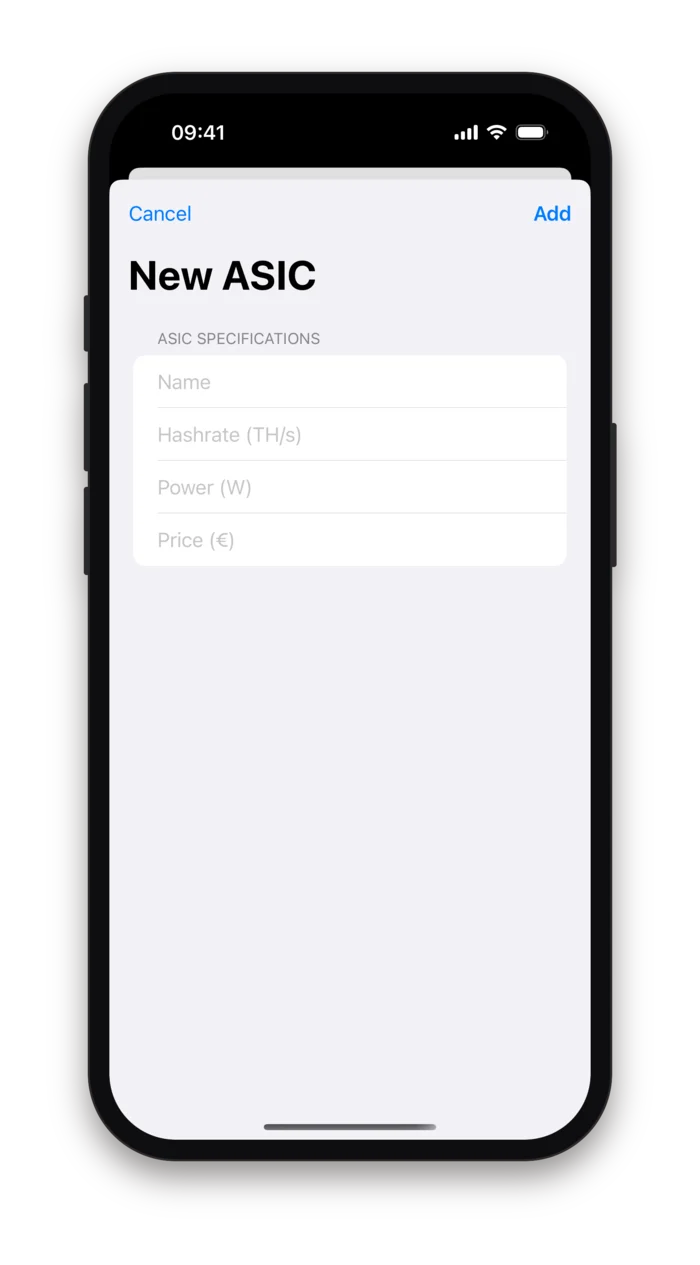
Add a model of your own with four numbers, swipe to delete one you will never buy, and Reset brings the built-in list back. The number of units is a field on the dashboard, so a farm is one miner times a count.
| Preset | TH/s | Watts | Price |
|---|---|---|---|
| Antminer S21 | 200 | 3,500 | €4,600 |
| Antminer S21 Hydro | 335 | 5,304 | €6,300 |
| Antminer S21 XP Hydro | 473 | 5,676 | €9,700 |
| Antminer S19 XP | 141 | 3,010 | €3,300 |
| Antminer S19k Pro | 120 | 2,760 | €2,400 |
| WhatsMiner M60S | 170 | 3,420 | €4,200 |
| WhatsMiner M66 | 280 | 5,600 | €6,800 |
| WhatsMiner M66S Hydro | 298 | 5,513 | €6,800 |
| WhatsMiner M63S Hydro | 390 | 7,215 | €8,700 |
| WhatsMiner M50S+ | 138 | 3,312 | €3,100 |
| Avalon Made A1466 | 150 | 3,230 | €3,700 |
What is assumed, and what is not
The model is deliberately simple enough to follow by hand. These are its fixed rules; everything else is a field you can change.
Your share of the network
Your hash rate divided by the global hash rate is your share of every block. Times 144 blocks a day, times the reward plus fees, gives BTC per day. No pool fee, no luck.
Fees from the mempool
The average fee per block is estimated from the current half-hour fee rate for a two-kilobyte transaction. It is a small term next to the 3.125 BTC subsidy, and you can overwrite it.
Usable capacity
The battery never charges beyond capacity times one minus the loss percentage. It starts the year empty.
Last year, not an average year
The irradiance is a real year, the previous one, so a cloudy spring in your region shows up as it happened. A ten-year mean would be smoother and less honest.
Fixed prices, repeated year
The BTC price, network hash rate, reward and fees are frozen at the values on screen for the whole horizon, and the first year repeats. Halvings, difficulty growth and hardware ageing are not modelled.
Euro figures
The BTC price is fetched in euros and the ASIC prices are in euros. Use whatever currency you like in the fields, as long as you use it everywhere.
Investment paid on day one
No financing, no depreciation, no taxes. Break-even is simply the month when cumulative net profit equals the money spent.
Hourly, not instantaneous
The simulation steps in whole hours. Inverter clipping, battery charge rate limits and the miners' own start-up behaviour are below its resolution.
Four public data sources, no account
The app talks to the open internet only to fetch numbers, and never sends anything about you. Your plan lives in the app's settings on the device. The App Store privacy label reads "Data Not Collected".
What it fetches
The BTC price from CoinGecko, the fee level from mempool.space, the block reward from blockchain.info and a year of hourly irradiance from Open-Meteo. The requests carry your coordinates to Open-Meteo and nothing else.
Location only when you ask
The GPS Location button asks for permission the first time and uses the fix to fill in the city and coordinates. Typing a place name uses Apple's geocoder instead and needs no permission.
Saved on the device
Every field, the chosen ASIC, the list of models and the slider position are stored in the app's settings. Deleting the app deletes them.
Nothing collected
No account, no analytics SDK, no crash reporting that leaves the device, no advertising.
Who it is for
Students and the curious
How mining, energy and money fit together, with every intermediate number on screen and nothing hidden in a formula cell.
Owners of a roof
You already have panels, or are quoting some. Would a miner in the garage turn the summer surplus into something better than the feed-in tariff?
Solar installers
A customer asks about mining. Ten minutes with the app gives a first answer in their own numbers, winter deficit included.
Small miners
Compare models, sizes and locations before spending. The simulated-price slider shows what the plan looks like if the market turns.
Released in July 2025 as version 1.0. The App Store listing also covers iPad, Macs with Apple silicon and Apple Vision Pro, where the same iPhone app runs.
Run the numbers before you buy a single panel.
BTC Miner Plan is an educational simulator. It does not mine, hold or trade cryptocurrency and it is not financial advice. The model repeats one year's cash flow, keeps the network hash rate, block reward, fees and Bitcoin price fixed at the values on screen, ignores halvings, difficulty growth, hardware failure, panel degradation and taxes, and uses hardware prices that go out of date. Treat the results as an order of magnitude and a way to see which assumption matters, not as a forecast.