Fouling Impact Calculator · Free · iPhone & iPad · iOS 17.6 or later
What fouling costs,
in fuel, CO₂ and dollars.
Below the waterline, slime and barnacles turn a smooth hull into a rough one, and the engine burns more fuel to hold the same speed. Fouling Impact Calculator puts a number on it: describe the ship, the voyage, the weather and the state of hull and propeller, and read the extra tonnes, the extra CO₂ and the extra cost.
The result is split three ways, fouling, weather and the interaction between them, so you can see what cleaning the hull would actually save on that route, and what it would not.
Version 1.1 · Listed on the App Store as "Biofouling Impact" · Works entirely offline
No account · No analytics · No tracking · Nothing collected
The invisible line item
Biofouling is the growth of microorganisms, algae and small animals on any surface that stays wet. On a ship it starts as a biofilm within days of a dry-docking and ends, left alone, as a hard crust. Every stage adds roughness, roughness adds resistance, and resistance is paid for in fuel: a thin slime layer costs a few percent, heavy calcareous fouling can cost more than thirty.
Nobody sees it from the deck, which is why it rarely gets a number. The app gives it one, by voyage, in the same units the rest of the operation uses: tonnes of fuel, tonnes of CO₂ and money. It runs on the phone, with no account and no data leaving it, so an estimate takes a minute on the bridge or in a meeting.
The ship
Eight vessel types and thirty-four size classes, from a Handysize bulker to an ULCV. Each carries a preset for engine power, design speed and daily fuel consumption, scaled from a reference ship of its type.
The voyage
A route from the built-in list or your own, or a plain distance or number of days. Sea state, wind, load condition and whether the engines hold speed or power.
The fouling
Hull and propeller rated separately, clean to heavy. The propeller is small but it matters: a fouled propeller alone can cost twelve percent.
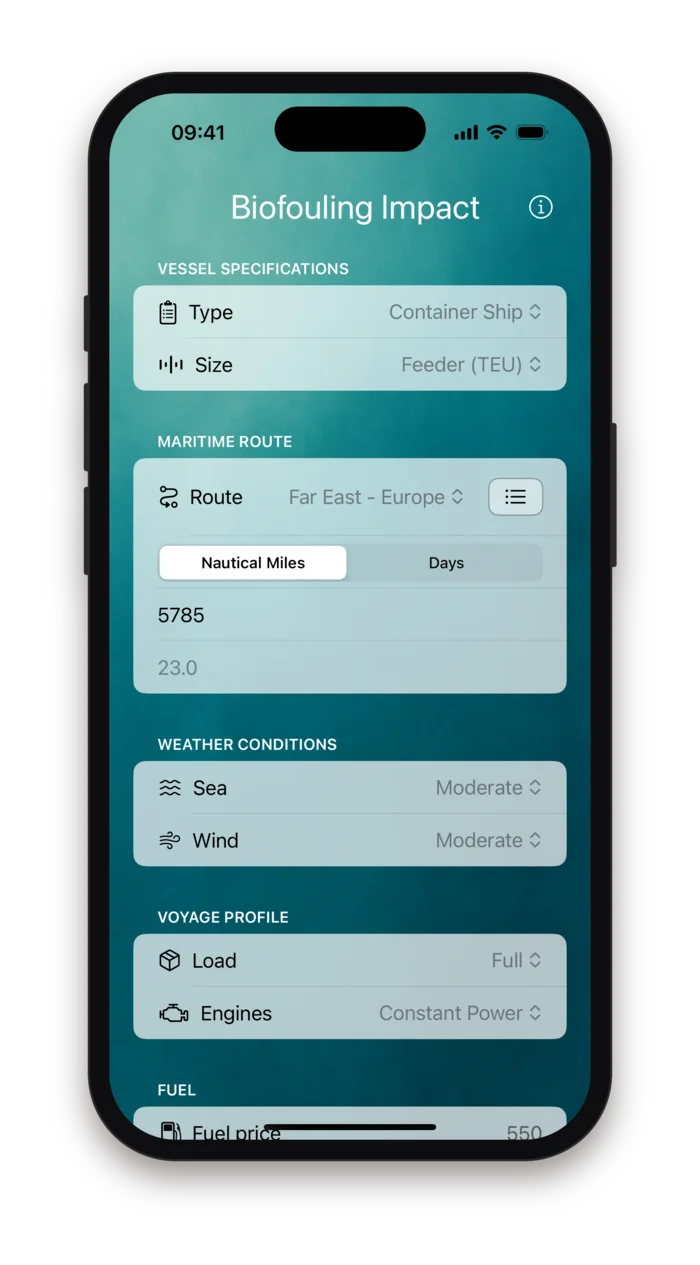
Describe the ship and the voyage
One form, top to bottom. Every change recalculates on the spot, and the last voyage you described is there when you come back.
- Type and size
- Bulk carrier, container ship, crude or product tanker, LNG or LPG carrier, ro-ro or vehicle carrier, then the size class in its own unit: deadweight tonnes, TEU, cubic metres, lane metres or CEU. Changing either recalculates everything.
- Route
- Pick one of the thirteen built-in trades or any route you have saved, and the distance fills in. Choose Custom to type nautical miles or operating days yourself; whichever you enter, the other is derived from the effective speed.
- Sea and wind
- Sea state from calm to very rough, wind from none to strong. Weather slows the ship and adds resistance of its own, and the model keeps that separate from fouling.
- Load and engines
- Ballast, partial or full load changes the wetted surface and the resistance. Constant speed burns the whole penalty as fuel; constant power gives up some speed instead.
- Fuel price
- Dollars per metric tonne, with 550 as a starting value. Every cost line in the results is simply tonnes times this figure.
- Hull and propeller fouling
- Clean, light, moderate or heavy for each. These two are the question the app exists to answer; everything above sets the context for it.
Read the breakdown
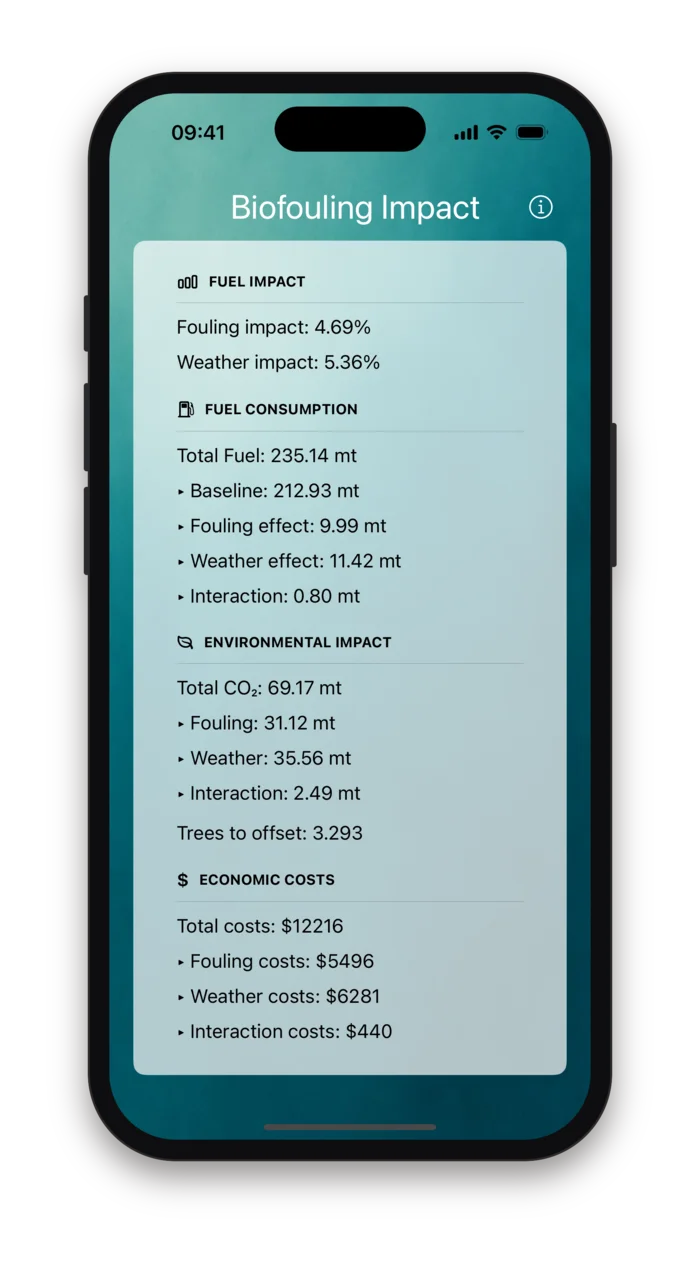
The Results section at the bottom of the form gives four blocks, each split by cause. Fouling and weather are reported as separate penalties on the baseline, and the small extra that appears only when both act together is shown on its own line as the interaction, so nothing is double-counted and nothing is hidden.
- Fuel impact
- The fouling penalty and the weather penalty, each as a percentage of baseline consumption.
- Fuel consumption
- Total tonnes for the voyage, then the baseline for a clean ship in calm water, the extra from fouling, the extra from weather, and the interaction term.
- Environmental impact
- The extra CO₂ in tonnes, split the same three ways at the heavy fuel oil factor of 3.114 tonnes of CO₂ per tonne burned, and the number of trees it would take a year to absorb it.
- Economic costs
- The extra fuel at your price, split by cause. The fouling line is the figure to set against a hull cleaning or a new coating.
The model in one line
resistance = (1 + hull + prop) · (1 + sea + wind) − 1penalty = resistance · (v / 15 kn)1.2 · mode · loadHull, propeller, sea and wind are percentage resistance penalties from the tables below. Faster ships pay more for the same roughness; constant-power operation absorbs part of it as lost speed rather than extra fuel.
Thirteen trade routes, and your own
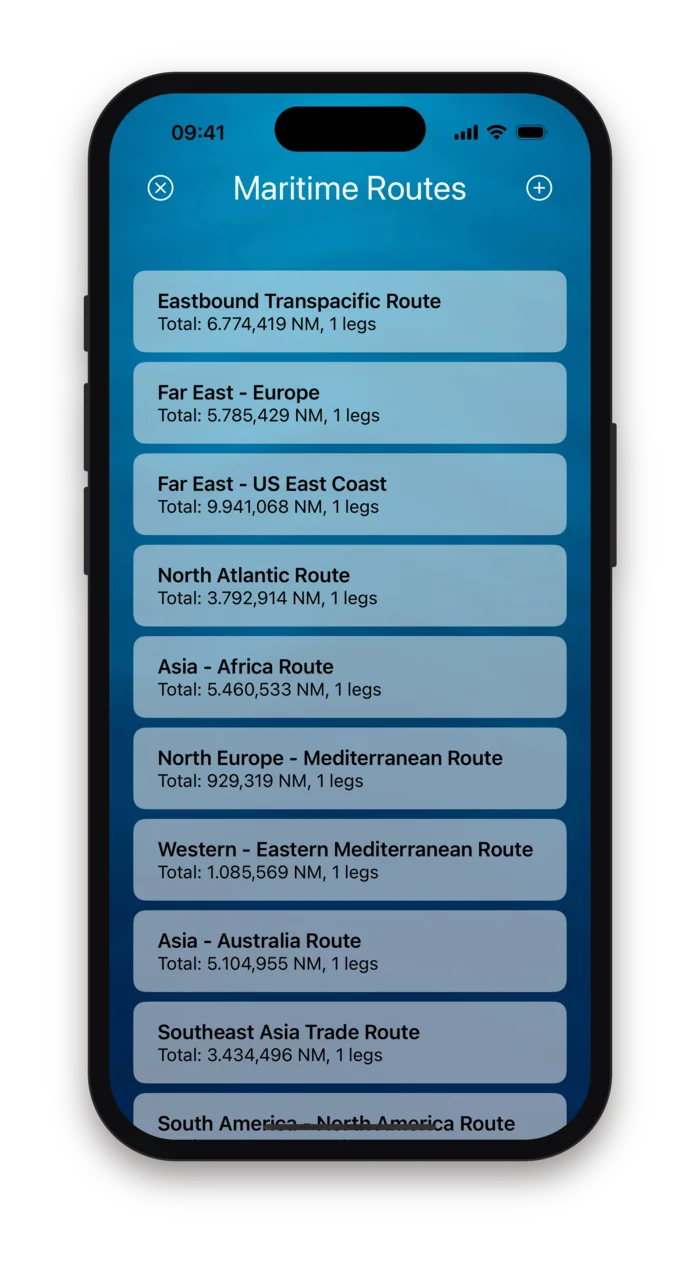
The route picker comes loaded with the main trades: Far East to Europe, the transpacific, North Atlantic, Middle East crude and LNG runs, Australian iron ore. Each is a distance in nautical miles; the app turns it into days from the ship's effective speed in the weather you set. You can also build your own routes, leg by leg, from a list of 117 ports.
Your routes
The thirteen built-in trades and any you add. Tap a route to see its legs, swipe to delete a route or a leg.
Legs
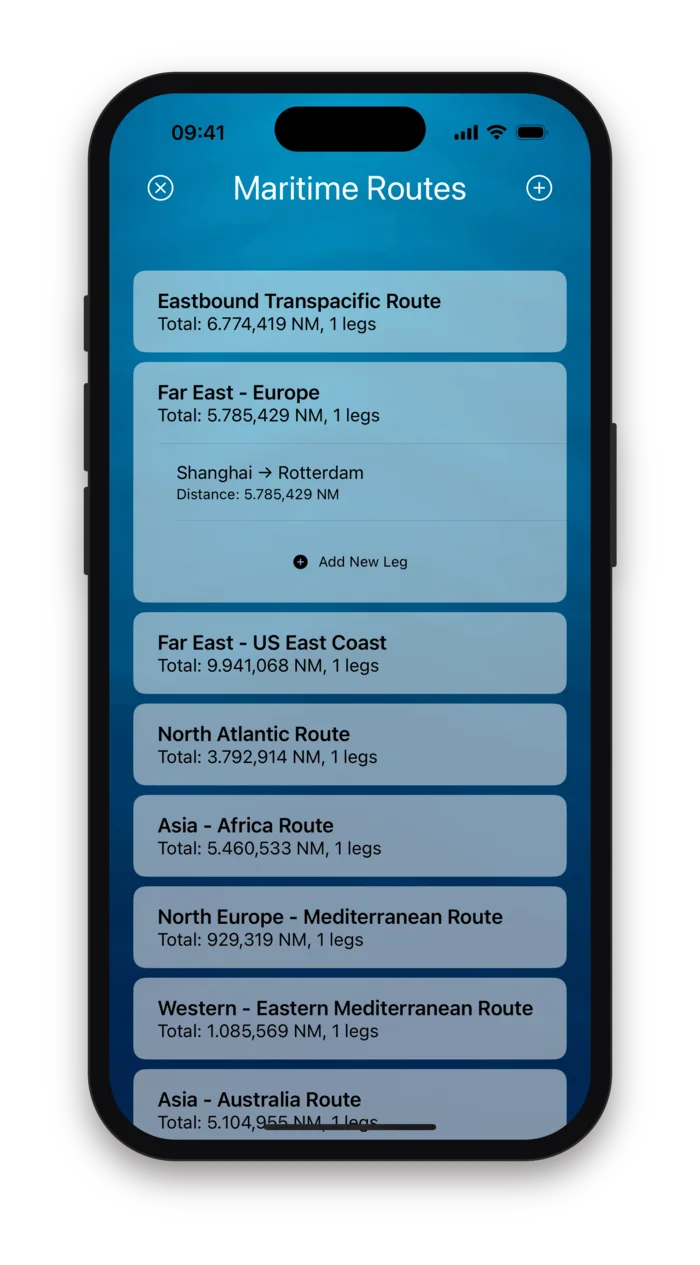
A route is a chain of port-to-port legs. The total is what the calculator uses; a multi-port rotation is just several legs.
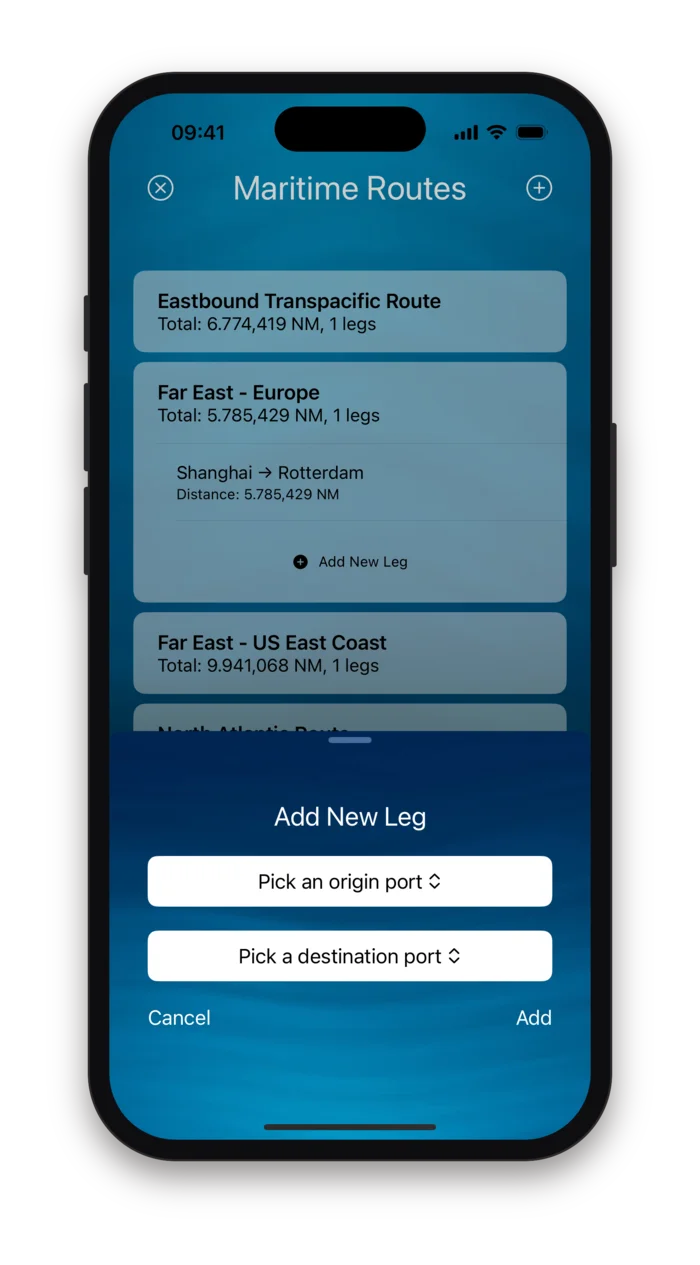
From a list of 117 ports
Origin and destination from pickers grouped by continent, Shanghai to Santos, Rotterdam to Ras Tanura. The distance is computed as you add the leg.
Leg distances are great-circle distances between the two ports with a 20 percent allowance for the real sea path, which is a fair first estimate for ocean legs and a rough one for coastal routes or canal transits. Type the exact distance in the form if you have it.
The numbers behind it
Every assumption in the model is a fixed, visible coefficient. They are typical values from the hull-performance literature, chosen to be conservative, and this is the complete list.
| Resistance penalty | Levels |
|---|---|
| Hull fouling | Clean 0%, light 5%, moderate 15%, heavy 30% |
| Propeller fouling | Clean 0%, light 2%, moderate 6%, heavy 12% |
| Sea state | Calm 0%, slight 2%, moderate 5%, rough 10%, very rough 20% |
| Wind | None 0%, moderate 3%, strong 8% |
| Load | Ballast ×0.95, partial ×1.00, full ×1.08 |
| Engines | Constant speed ×1.0, constant power ×0.7 |
| Speed | (design speed ÷ 15 knots) to the power 1.2 |
| CO₂ | 3.114 t per tonne of heavy fuel oil |
Presets scale with size
Within a vessel type, engine power grows a little less than proportionally with size, speed grows slowly, and daily fuel consumption grows in proportion. A Capesize bulker is not a scaled-up Handysize, but the preset gets the order of magnitude right.
Baseline first
The baseline is the fuel a clean ship would burn in calm water: distance divided by design speed, times daily consumption. All penalties are applied to that figure, so the breakdown always adds up.
Days from miles
When you give a distance, days are derived from the design speed reduced for sea, wind, load and operating mode, so a rough passage is correctly a longer one.
Trees, for scale
One mature tree absorbs about 21 kg of CO₂ a year. The figure is there to make tonnes of gas imaginable, not as an offset calculation.
Your fleet's numbers stay on your phone
The app has no server and makes no connection. Vessel choices, fuel price, routes and legs are saved on the device so they are there next time, and nowhere else. The App Store privacy label reads "Data Not Collected".
No connection, ever
No server, no sign-in, no update check, no analytics. The app works the same in port, at sea and in airplane mode.
Saved on the device
Your vessel, route, weather, fouling and fuel price choices are kept in the app's settings; routes and legs in a file in its documents folder. Deleting the app deletes them.
No account, no profile
The app does not know which company or ship it is being used for, and does not ask.
Nothing collected
No advertising SDK, no tracking technology, no crash reporting that leaves the device.
Who it is for
Superintendents and operators
A first number for the cost of the current hull condition on the next voyage, to weigh against a cleaning or a docking.
Coating and cleaning suppliers
A neutral calculator to show a customer what fouling costs on their own trade, with the assumptions on the table.
Maritime students
The relation between roughness, resistance, speed and fuel in a form you can play with, every coefficient visible.
Sustainability teams
Fouling is an emissions line that cleaning can actually remove. The CO₂ breakdown puts it in the same units as the rest of the report.
Released in May 2025. Version 1.1 added the split between fouling, weather and their interaction, persistent inputs, and a Done key for the number fields.
Know what the hull is costing before the next docking.
Fouling Impact Calculator is an estimation tool for education and first-order planning. Vessel presets are generic for each type and size class, fuel is assumed to be heavy fuel oil, resistance penalties are typical literature values, and route distances are approximations. Results indicate the order of magnitude of the effect, not the figure for a particular ship; a real assessment needs the vessel's own performance data. Nothing here is advice on docking, cleaning, coating or compliance.