AWS Spend · Mac · macOS 26.3 or later
The AWS bill,
in the menu bar.
AWS Spend shows what this month's AWS usage has cost so far, right in the Mac menu bar, and a click away the forecast for the month, last month's total and the change between them. Behind it is a dashboard of the last fourteen months by service, with tax shown as its own band, a top-services chart for any month you click, several accounts as tabs and a CSV export.
It reads AWS Cost Explorer directly with a read-only key you create for it. The key lives in the macOS Keychain; there is no server of ours in between, no account, no analytics.
Version 1.1 · One-time purchase
No account · No server · No analytics · Keys stay in the Keychain
Know before the invoice
The AWS console tells you what you have spent, if you log in, find Billing, open Cost Explorer and wait for the page. Most people look once a month, when the invoice arrives and the surprise is already paid for. The number that matters, what this month is on track to cost, should be visible without any of that.
AWS Spend keeps it in the menu bar, next to the clock. The popover adds the forecast and last month. The window adds the history: which service grew, which month jumped, how much of the bill is tax. It is a reader of your own billing data, built to be glanced at, and it does nothing else.
Menu bar
Account name and month-to-date cost, always on screen. Click for forecast, previous month, the change, and a switch between accounts.
Dashboard
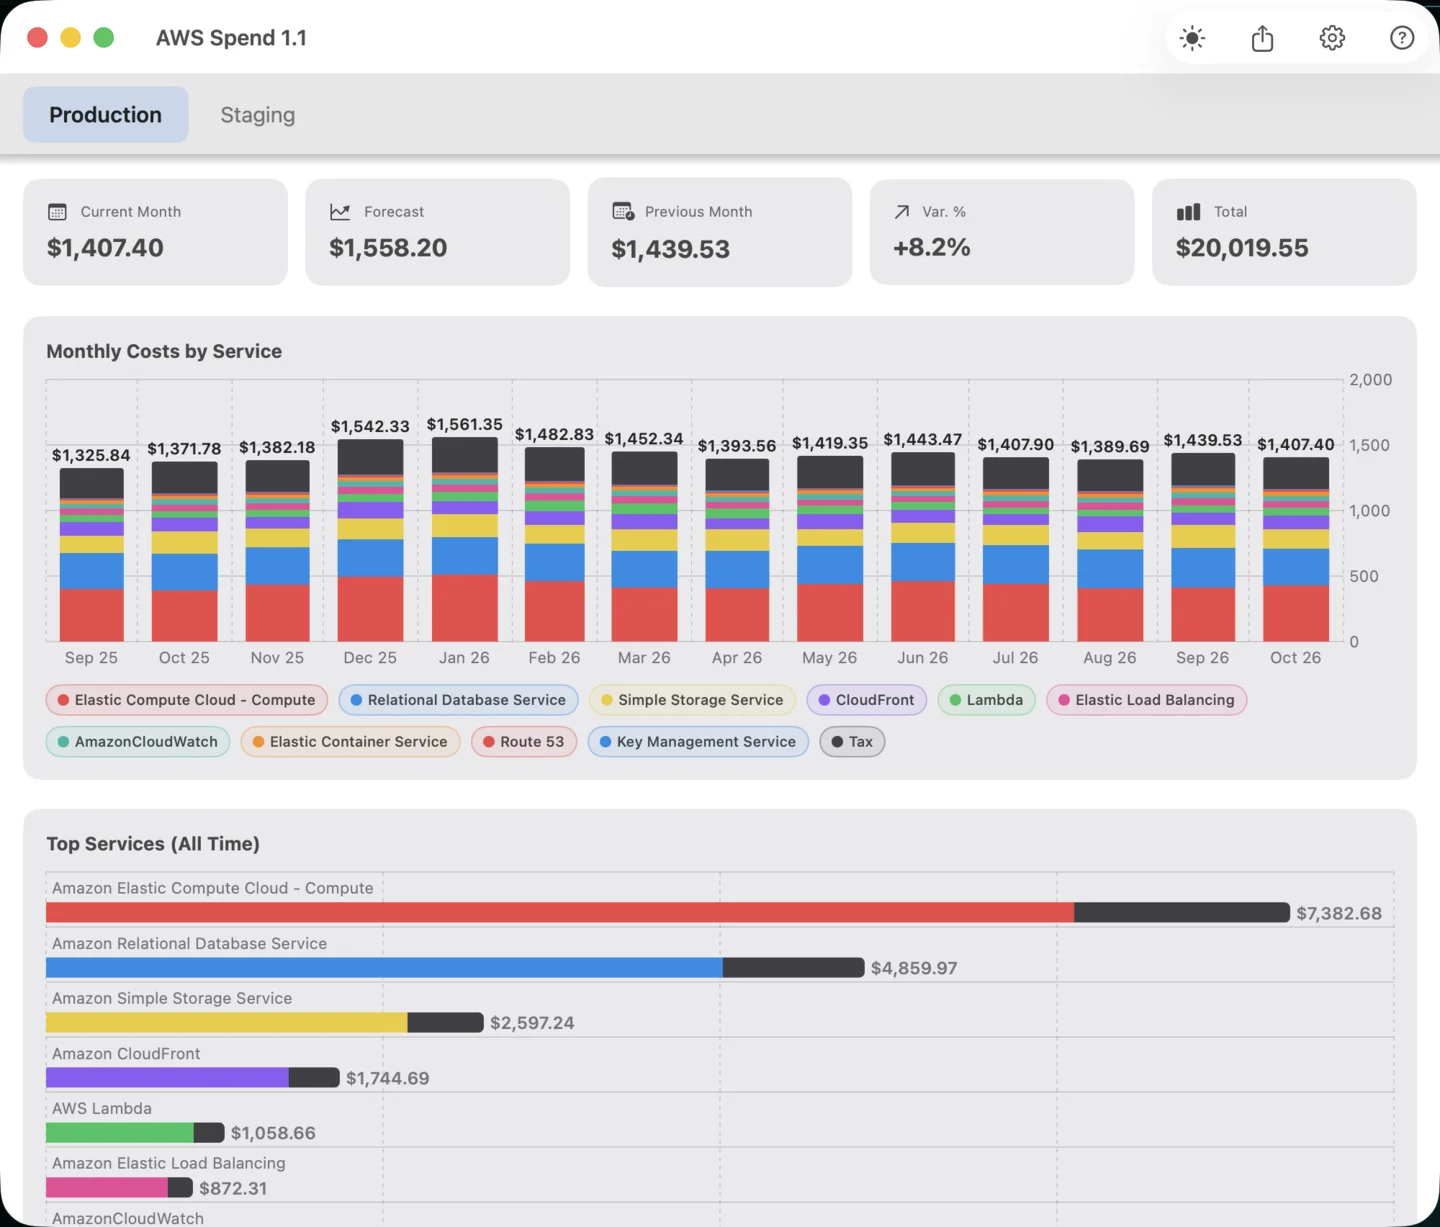
Fourteen months stacked by service with totals, tax as its own band, a top-services chart for all time or for the month you click, light or dark.
Your own key
A read-only IAM key per account, stored in the Keychain, used by the app to call Cost Explorer directly. No middleman, no sign-up.
A number next to the clock
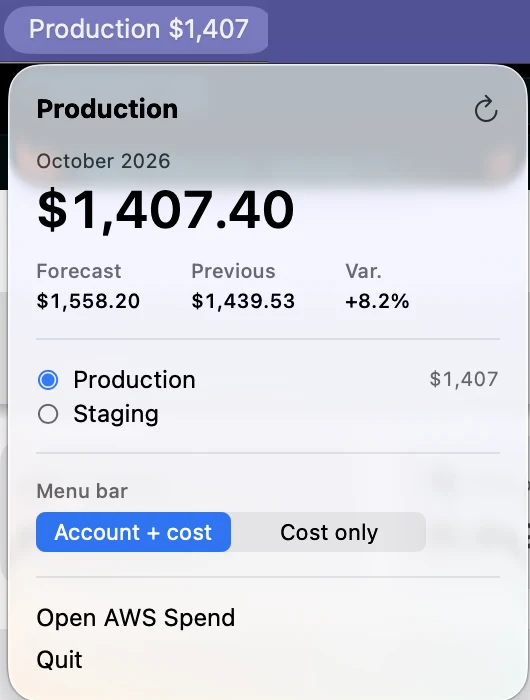
The menu bar item reads the selected account's name and its month-to-date cost, or just the cost if you prefer. Click it for the month in full: the amount, the forecast, the previous month and the percentage change, a switch between accounts, and a button to open the window. The app can stay closed; the menu bar item is enough for most days.
- Current month
- The unblended cost of the selected account from the first of the month to yesterday, the last day Cost Explorer has usually finished reporting.
- Forecast
- The month-to-date cost divided by the days completed and multiplied by the days in the month. Simple, and honest about being a projection.
- Previous month and change
- Last month's total, and the forecast against it as a percentage, so a month that is drifting up shows a plus sign before it is over.
- Account + cost or cost only
- Choose how much the menu bar item says. With one account, the cost alone is the quieter choice.
The history, by month and by service
The window is one scrolling dashboard per account. Summary cards at the top, the stacked monthly chart in the middle, the top services at the bottom. Everything on it comes from one Cost Explorer query: unblended cost, grouped by service, month by month, for the last fourteen months.
Click a month
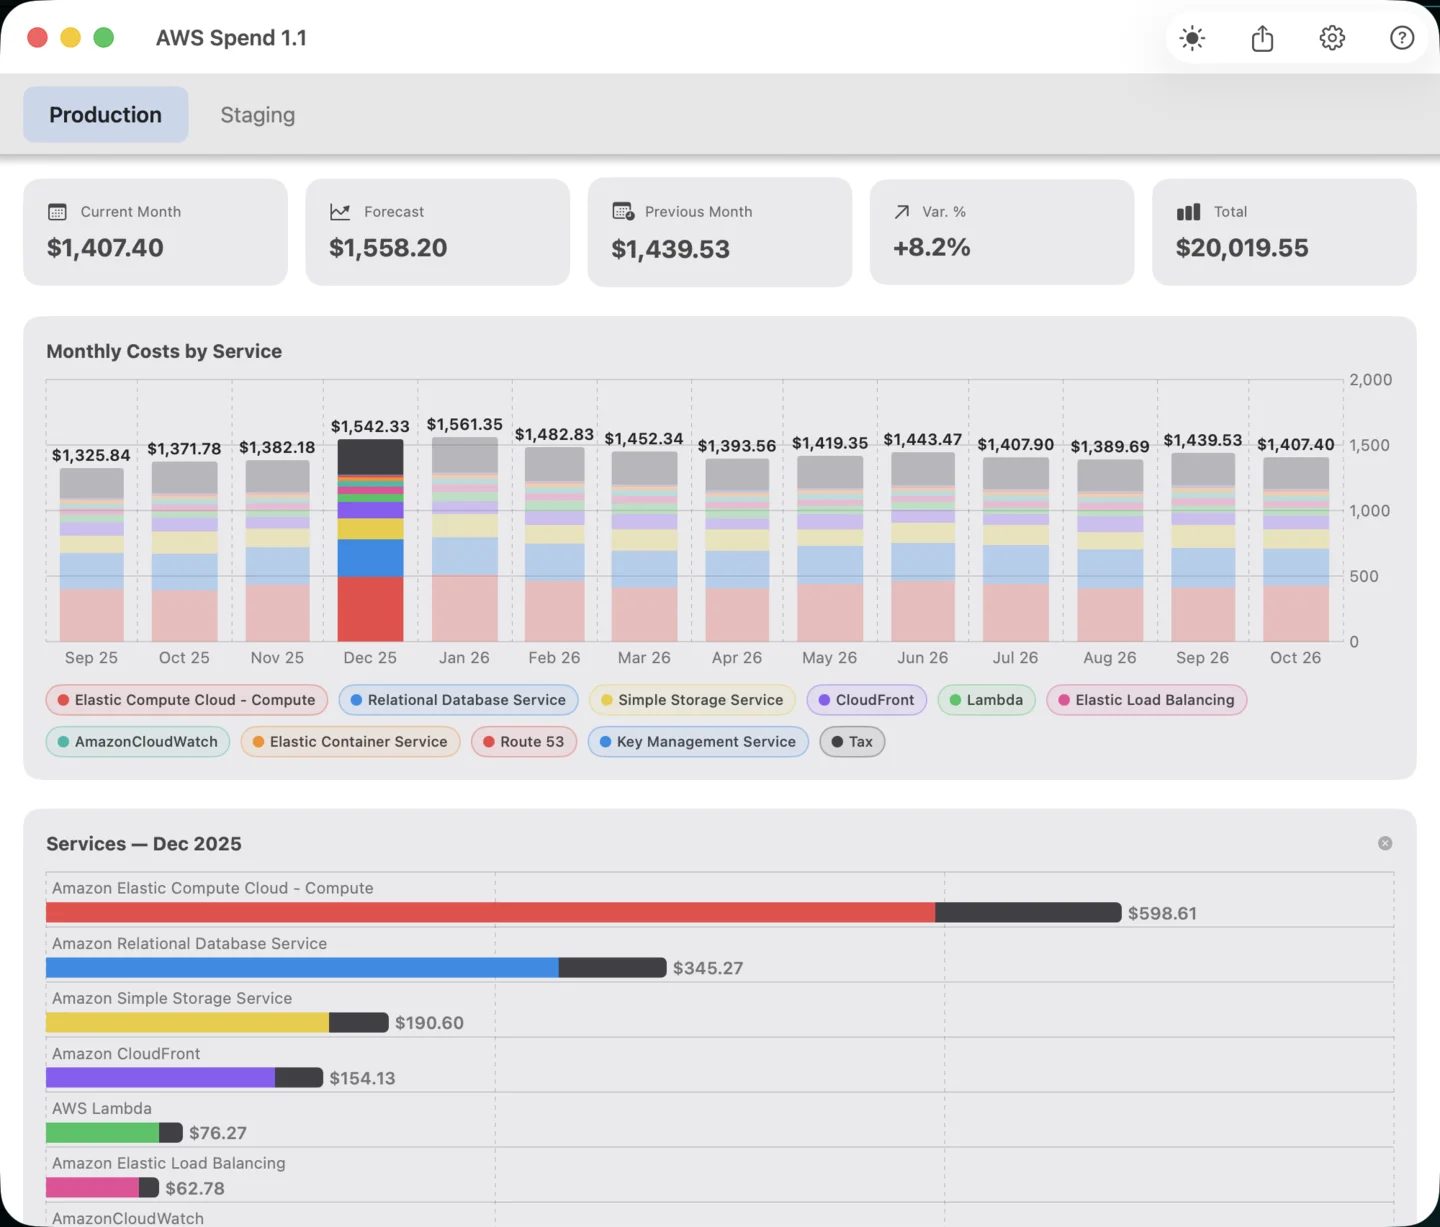
The top-services chart switches from all time to that month, with each service's share of tax appended to its bar in grey. Click the month again to go back.
Dark mode
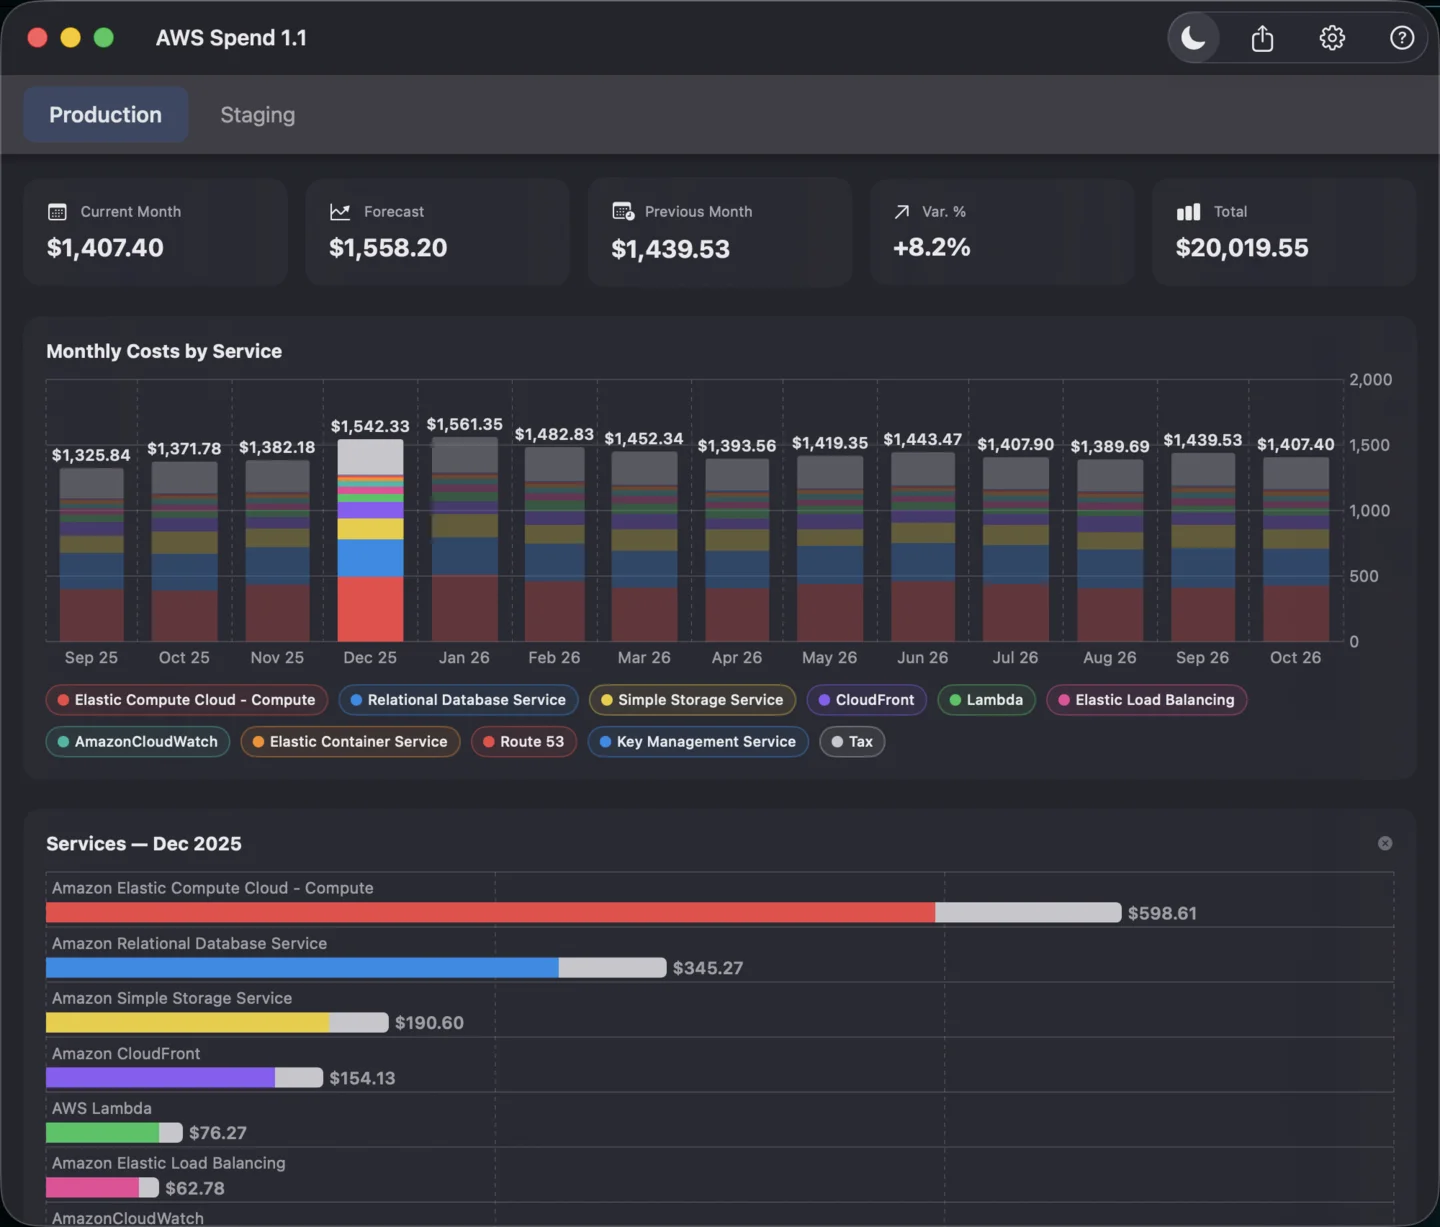
A toolbar button switches the window between light and dark independently of the system, and the choice is remembered.
- Summary cards
- Current month, forecast, previous month, the percentage change and the total of the whole period, in USD or your currency.
- Stacked by service
- One bar per month, one colour per service, the month total printed on top. Services are stacked by size, tax always on top in grey.
- Interactive legend
- Click a service in the legend to hide it; totals and the top-services chart leave it out, and tax is reduced in proportion. Click again to bring it back.
- Nine palettes
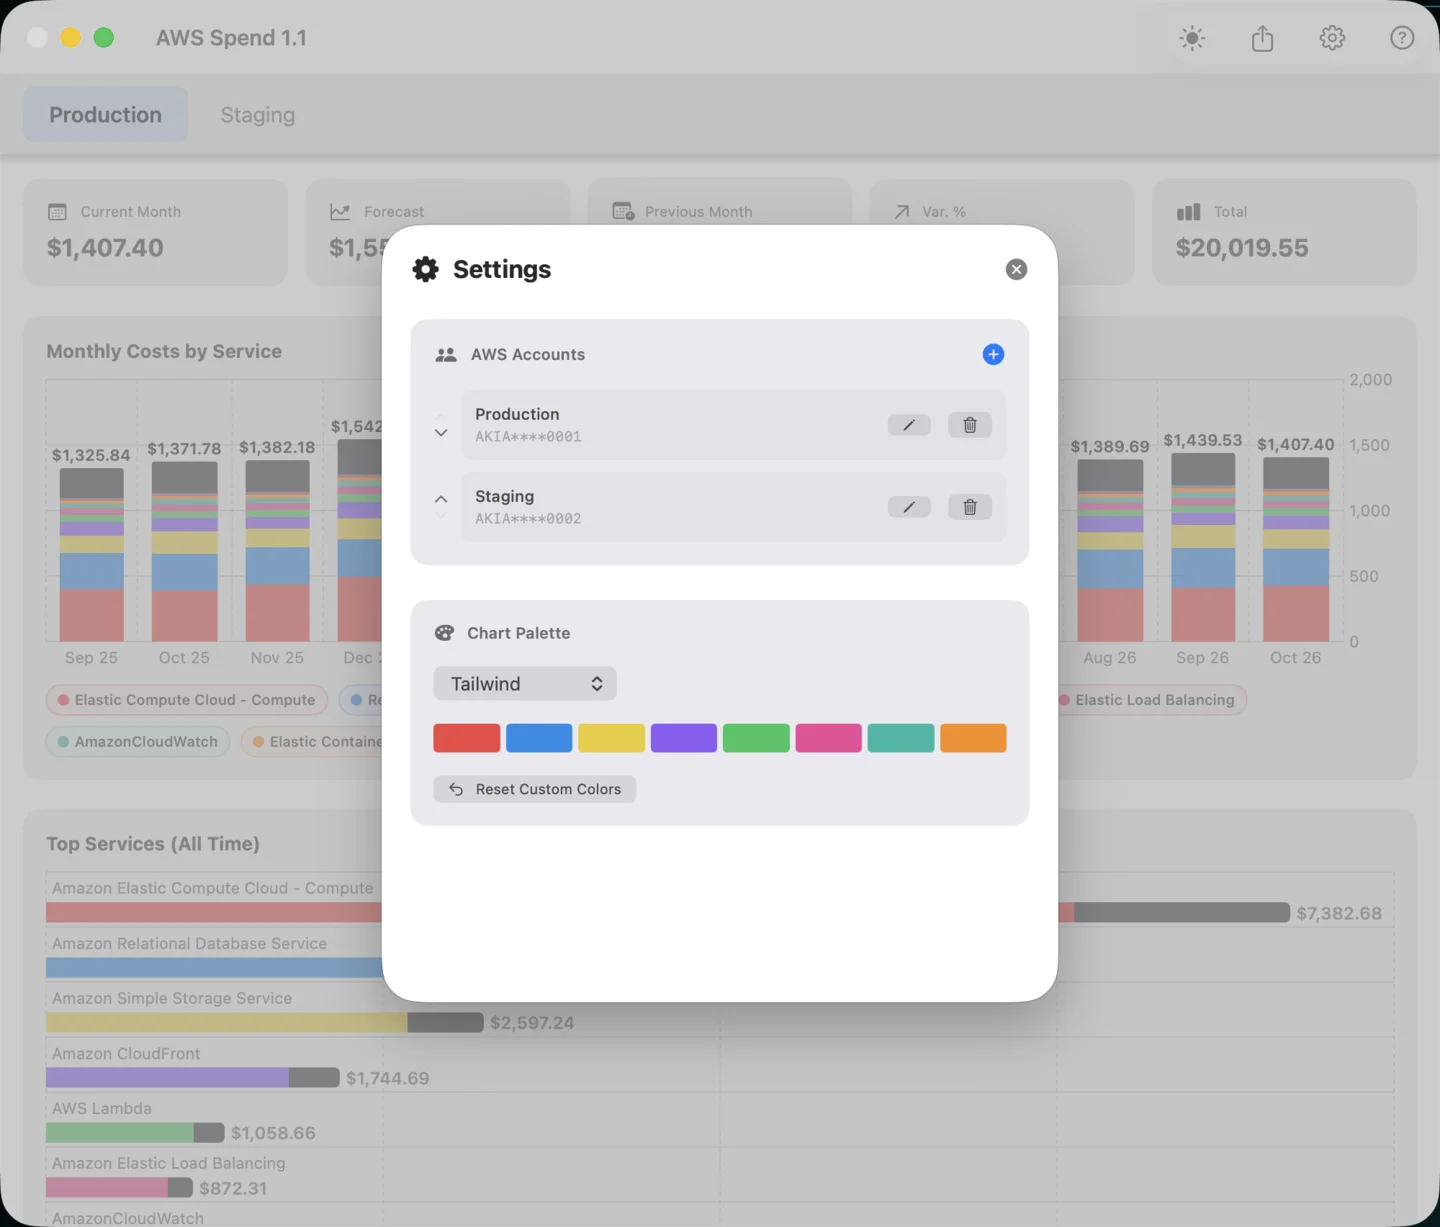
- Tailwind, Warm, Cold, Pastel, Fluo, Earth, Ocean, Sunset and Monochrome. If two services end up too alike, double-click one bar and then the other to swap their colours; the swap is remembered.
- Several accounts
- Each account is a tab with its own dashboard, named as you like: clients, environments, the personal one. Reorder them in Settings.
- Export to CSV
- The share button writes the whole period as a table, one row per month and one column per service plus the total, in the currency on screen.
A read-only key, once per account
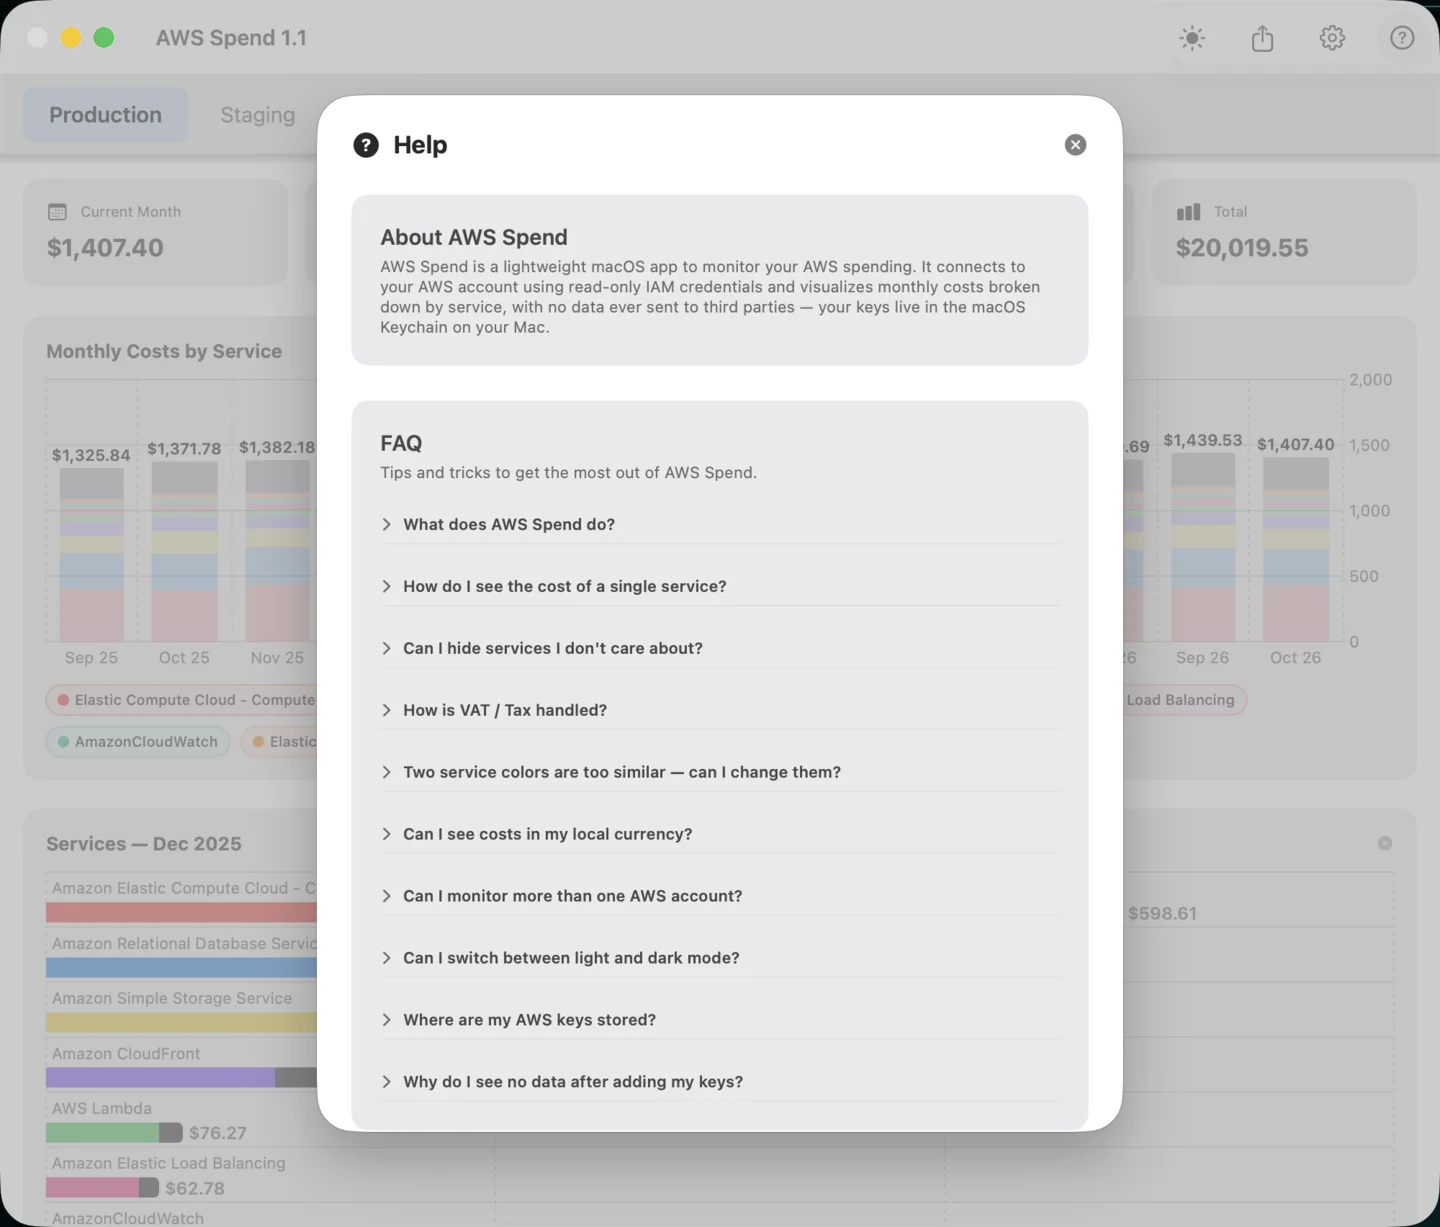
AWS Spend needs an IAM access key that can call Cost Explorer and nothing else. The Help window walks through the four steps in the AWS console, with the policy ready to copy: create the policy, create a user with it, generate the key, paste it into Settings. The key cannot start, change or delete anything in your account.
The whole IAM policy
{
  "Version": "2012-10-17",
  "Statement": [{
    "Effect": "Allow",
    "Action": [
      "ce:GetCostAndUsage",
      "ce:GetCostForecast",
      "ce:GetDimensionValues"
    ],
    "Resource": "*"
  }]
}
Add as many accounts as you manage, each with its own key and a name. They become tabs in the window and a list in the menu bar popover, in the order you set.
How the numbers are made
Nothing is estimated except the forecast, and the forecast is one line of arithmetic.
One query
GetCostAndUsage with monthly granularity, the UnblendedCost metric and a GroupBy on SERVICE, from thirteen months ago to today. The response is the same data the AWS console shows.
Tax, separately
AWS reports tax as a service of its own. The app keeps it as a separate band on the chart and, in the top-services view, spreads it over the visible services in proportion to their cost, so each bar reads as what that service really costs you.
Your currency
If the Mac is not set to US dollars, Settings offers your currency with a rate from open.er-api.com, refreshed on demand and shown with its timestamp. Cost Explorer itself always answers in USD.
Signed on the Mac
Requests are signed with AWS Signature Version 4 by the app itself and sent to the Cost Explorer endpoint in us-east-1, the only region it has.
A day behind
Cost Explorer typically finalises a day's costs the day after. The current-month figure and the forecast exclude today for that reason, so the first of the month shows the previous month's last day as its only data.
A linear forecast
Spend so far divided by days elapsed, times days in the month. It is a fair guess for steady workloads and a poor one for a batch job that runs on the 28th.
A cent a call
AWS bills Cost Explorer API requests individually. The app sends one per account each time it refreshes: at launch, when you pull to refresh, or when you press the refresh button in the popover.
Cost Explorer must be on
If it has never been enabled in the Billing console, the API answers with an error. The Help window and the empty state both say so.
Between your Mac and AWS, nobody
The app signs each request itself and sends it to Cost Explorer. Your keys and your billing figures never pass through a server of ours, because there is none. The only other connection is an exchange-rate lookup, and only if you ask to see the figures in your own currency.
Keys in the Keychain
Access key and secret are stored by macOS in the Keychain under the app's own entry. Account names and preferences are in the app's settings.
Read-only by design
The IAM policy the app asks for grants three Cost Explorer actions and nothing else. Even a leaked key could only read billing figures.
Two destinations
ce.us-east-1.amazonaws.com for costs, and open.er-api.com for an exchange rate when you choose a currency other than USD. Nothing else, ever.
Nothing collected
No account, no analytics, no crash reporting, no update check. Sandboxed, with network access only as a client.
Who it is for
Solo developers
A side project on a few services, and the quiet dread of the monthly invoice. The menu bar number replaces the dread.
Agencies and consultants
One tab per client account, named by client. The CSV export is the attachment for the monthly report.
Startups
Production and staging side by side, and the moment a change doubles the RDS line is visible the next morning, not at the end of the month.
DevOps and FinOps
The quick view between the proper tools: is this month on track, and which service moved. The console remains for everything else.
First released in April 2026. Version 1.1, from August 2026, added the menu bar item with its popover, the CSV export, the chart palettes with colour swapping, month drill-down, legend toggles and a refreshed dashboard and dark mode.
See this month's number before the invoice does.
The screenshots on this page show synthetic figures, not a real account. AWS Spend is an independent product and is not affiliated with, endorsed by or sponsored by Amazon Web Services; AWS and Cost Explorer are trademarks of Amazon.com, Inc. You need an AWS account with Cost Explorer enabled, and AWS charges a small fee per Cost Explorer API request, currently a cent each; the app makes one request per account per refresh. The forecast is a linear projection and the local-currency figures use a third-party exchange rate; your invoice is the only authoritative number.